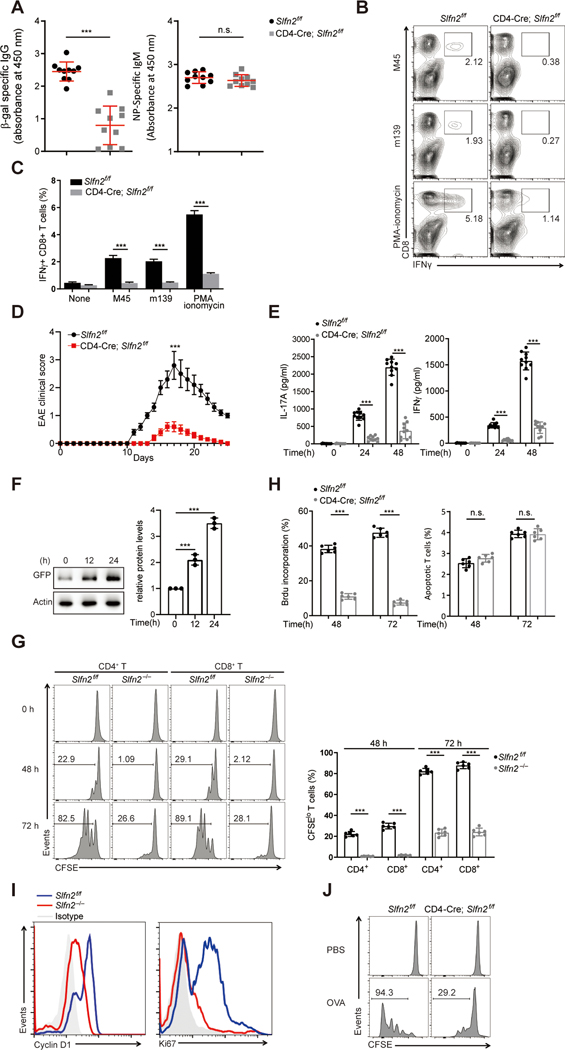
Fig. 1. Impaired T cell-mediated immunity in T cell-specific SLFN2-deficient mice.
(A) Serum β-gal-specific IgG on day 14 after immunization (left) and NP-specific IgM on day 7 after immunization (right) of Slfn2f/f and CD4-Cre; Slfn2f/f mice (n=10 per genotype) with rSFV-encoded β-gal and NP-Ficoll, respectively. Each symbol represents an individual mouse. (B) Representative flow cytometry analysis of IFN-γ+ CD8+ T cells isolated from the spleens of Slfn2f/f and CD4-Cre; Slfn2f/f mice on day 10 after MCMV infection and then stimulated in vitro with MCMV peptides m139 or M45 or PMA–ionomycin. Numbers indicate percent cells in boxed area. (C) Quantification of the percentage of IFN-γ+ CD8+ T cells among 1×10⁶ spleen cells assessed by flow cytometry as in B (n=4 per genotype). (D) Mean EAE clinical scores of age-matched Slfn2f/f and CD4-Cre; Slfn2f/f mice (n=10 per genotype) on the indicated days after immunization with MOG35–55. (E) IL-17 (left) or IFN-γ (right) concentration in the culture medium of spleen cells harvested from Slfn2f/f and CD4-Cre; Slfn2f/f mice (n=10 per genotype) on day 10 after MOG35–55 immunization and stimulated with MOG35–55 in vitro for the indicated time. (F) Immunoblot analysis of GFP-SLFN2 expression in splenic T cells isolated from BAC transgenic mice expressing GFP-tagged SLFN2 and stimulated with anti-CD3/CD28 for the indicated time (left). Quantification of the average intensity of the GFP-SLFN2 protein bands normalized to time 0 hour from three independent experiments (right). (G) Representative flow cytometry analysis of CFSE intensity in splenic Slfn2f/f or Slfn2−/− (from CD4-Cre; Slfn2f/f mice) CD4+ and CD8+ T cells left unstimulated or stimulated with anti-CD3/CD28 for 48 hours and 72 hours (left). Numbers indicate percent dye-positive cells in bracketed region. Frequency of CFSElo cells among dye-positive CD4+ and CD8+ T cells stimulated with anti-CD3/CD28 antibodies for 48 hours and 72 hours (n=6 per genotype) (right). (H) Percentage of Slfn2f/f and Slfn2−/− splenic T cells that incorporated BrdU or expressed annexin V (apoptotic cells) 48 hours and 72 hours after anti-CD3/CD28 stimulation, assessed by flow cytometry (n=6 per genotype). (I) Representative flow cytometry analysis of intracellular cyclin D1 and Ki67 expression in splenic T cells isolated from Slfn2f/f and CD4-Cre; Slfn2f/f mice (n=6 per genotype) and stimulated with anti-CD3/CD28 for 48 hours. Isotype, Slfn2f/f T cells stained with isotype-matched control antibody. (J) CFSE-labeled OT-1 T cells from Slfn2f/f and CD4-Cre; Slfn2f/f mice (n=3 per genotype) were adoptively transferred into Rag1−/− recipients. Representative flow cytometry analysis of CFSE intensity in OT-1 T cells isolated from the spleens of Rag1−/− recipients 72 hours after OVA immunization (n=3 per genotype). Numbers indicate percent dye-positive cells in bracketed region. P-values were determined by Student’s t test and error bars indicate SD except that mean clinical EAE scores were analyzed by the Mann–Whitney U test (n.s., not significant, *P<0.5, **P <0.01, ***P <0.001). Data are representative of two (I) or three (A to H, J) independent experiments.

