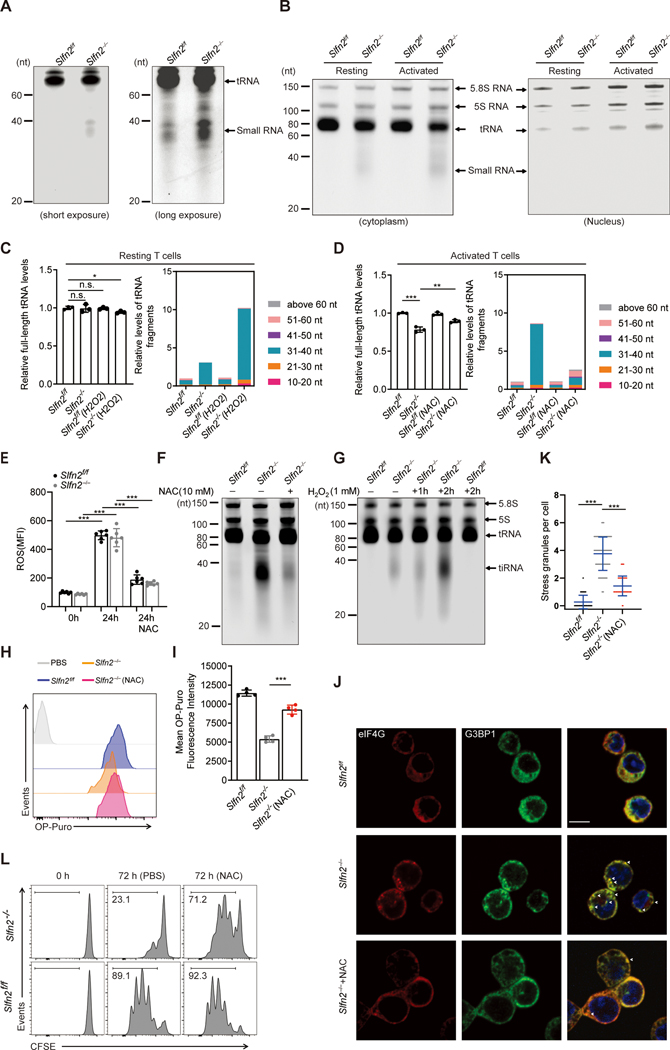
Fig. 5. Antioxidant inhibition of ROS prevents accumulation of tRNA fragments, suppression of translation, and stress granule assembly, permitting activation-induced proliferation of SLFN2-deficient T cells.
(A) Total RNA extracted from unstimulated Slfn2f/f or Slfn2−/− (from CD4-Cre; Slfn2f/f mice) splenic T cells, separated by 15% denaturing urea PAGE, and visualized by SYBR Gold staining. Positions of tRNA and 30–40-nt small RNA fragments are indicated. (B) Slfn2f/f or Slfn2−/− T cells were left unstimulated or stimulated with anti-CD3/CD28 antibodies for 24 hours. Cell lysates were fractionated into nuclear and cytoplasmic fractions before total RNA was isolated from each fraction, separated by 15% denaturing urea PAGE, and visualized by SYBR Gold staining. Positions of 5.8S RNA, 5S RNA, tRNA, and 30–40-nt RNA fragments are indicated. See also fig. S4 for longer exposure. (C and D) RNA-seq analysis of relative levels of full-length tRNAs (left) and relative levels of tRNA-derived fragments with indicated size ranges (right) from (C) resting Slfn2f/f or Slfn2−/− T cells left untreated or treated with 1 mM H2O2 for 2 hours or (D) Slfn2f/f or Slfn2−/− T cells stimulated with anti-CD3/CD28 for 24 hours in the presence or absence of 10 mM NAC (n=3 mice per genotype and treatment). (E) ROS levels in Slfn2f/f or Slfn2−/− splenic T cells (n=6 mice per genotype) as assessed by staining with DCF-DA. T cells were stimulated for 24 hours with anti-CD3/CD28 in the presence or absence of NAC prior to DCF-DA staining. (F) Total RNA from Slfn2f/f or Slfn2−/− splenic T cells stimulated with anti-CD3/CD28 for 24 hours in the presence or absence of NAC was separated by 15% denaturing urea PAGE and visualized by SYBR Gold staining. (G) Total RNA from unstimulated Slfn2f/f or Slfn2−/−splenic T cells treated with 1 mM H2O2 for indicated time was separated by 15% denaturing urea PAGE and visualized by SYBR Gold staining. Positions of 5.8S RNA, 5S RNA, tRNA, and 30–40-nt RNA fragments are indicated. (H) Representative flow cytometry analysis of OP-puro fluorescence in Slfn2f/f or Slfn2−/− splenic T cells stimulated with anti-CD3/CD28 in the presence or absence of NAC for 24 hours and then labeled with OP-puro for 30 min. PBS was used as a negative control. (I) OP-puro mean fluorescence intensity in Slfn2f/f or Slfn2−/− splenic T cells (n=4 mice per genotype), stimulated with anti-CD3/CD28 in the presence or absence of NAC for 24 hours and then labeled with OP-puro for 30 min. (J) Confocal immunofluorescence microscopy images of G3BP1 (green) and eIF4G (red) in Slfn2f/f or Slfn2−/− splenic T cells stimulated with anti-CD3/CD28 in the presence or absence of NAC for 24 hours. Cell nuclei were stained with SYTOX Deep Red (blue). Scale bar: 10 μm. (K) Quantification of stress granules (G3BP1+eIF4G+) in Slfn2f/f or Slfn2−/− splenic T cells stimulated as in J (n=100 cells per genotype). (L) Representative flow cytometry analysis of CFSE intensity in Slfn2f/f or Slfn2−/− splenic T cells stimulated with anti-CD3/CD28 in the presence or absence of NAC for 72 hours. Numbers indicate percent dye-positive cells in bracketed region. P-values were determined by Student’s t test (n.s., not significant, *P<0.5, **P<0.01, ***P<0.001). Data are representative of three independent experiments (A and B, E to L), and error bars indicate SD.

