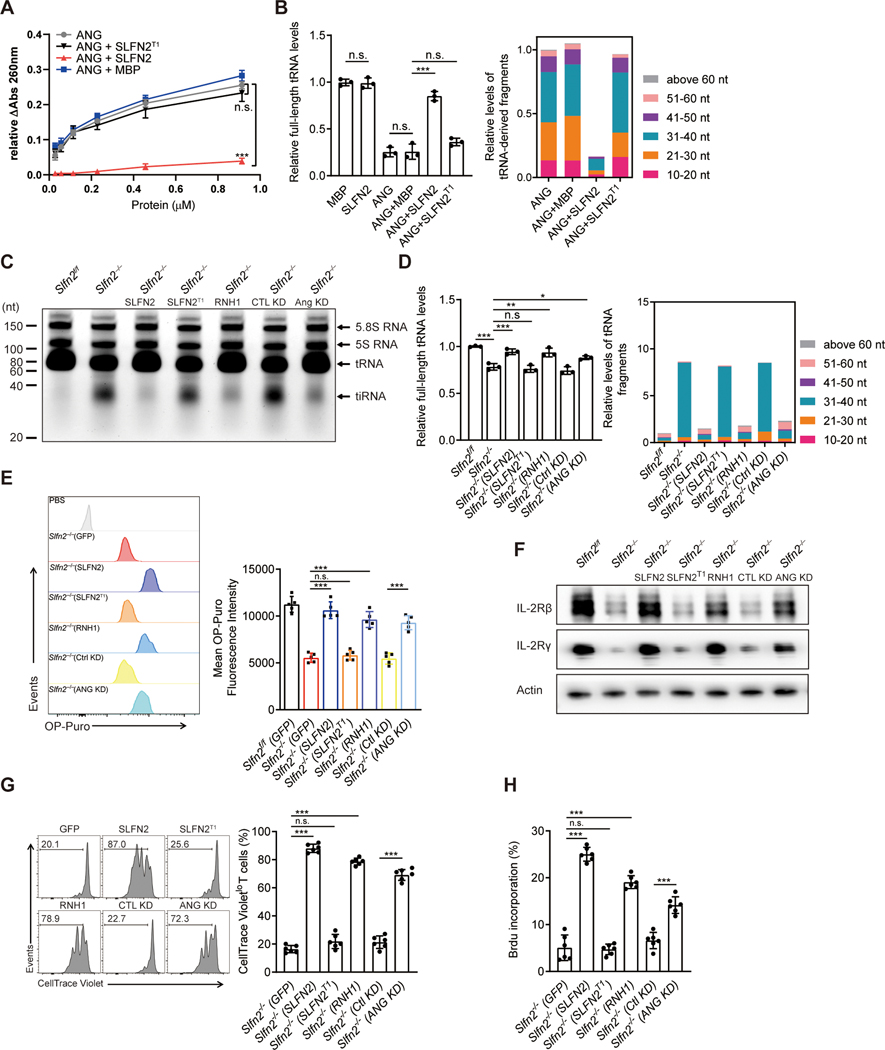
Fig. 6. SLFN2 protects tRNAs from ANG-mediated cleavage in T cells.
(A) tRNA cleavage activity of mouse ANG towards 2 μM yeast total tRNA in the presence of 2 μM recombinant MBP (negative control), SLFN2, or SLFN2 T1, as measured by the release of perchloric acid-soluble fragments detected by absorbance at 260 nm. (B) RNA-seq analysis of relative levels of full-length tRNAs (left) and relative levels of tRNA-derived fragments with indicated size ranges (right). Total tRNA and tRNA-derived fragments were isolated from in vitro yeast tRNA cleavage assays performed with 1 μM mouse ANG and 2 μM indicated other proteins (n=3 assays per condition). (C) Total RNA extracted from activated Slfn2f/f or Slfn2−/− splenic T cells expressing the indicated proteins or shRNAs for 72 hours, separated by 15% denaturing urea PAGE, and visualized by SYBR Gold staining. Positions of tRNA and 30–40-nt tiRNA are indicated. (D) RNA-seq analysis of relative levels of full-length tRNAs (left) and relative levels of tRNA-derived fragments with indicated size ranges (right) isolated from activated Slfn2f/f or Slfn2−/− splenic T cells expressing the indicated proteins or shRNAs (n=3 per genotype) for 72 hours. (E) Representative flow cytometry analysis of OP-puro fluorescence in activated Slfn2−/− splenic T cells expressing the indicated proteins or shRNAs for 48 hours, followed by OP-Puro or PBS incubation (with “Slfn2−/−(SLFN2)” as a control) for 30 min (left). Quantified OP-puro mean fluorescence intensity is shown (n=5 per genotype) (right). (F) Immunoblot analysis of IL-2Rβ and IL-2Rγ in activated Slfn2f/f or Slfn2−/− splenic T cells expressing the indicated proteins or shRNAs for 48 hours. (G) Representative flow cytometry analysis of CellTrace Violet intensity in activated Slfn2−/− splenic T cells expressing the indicated proteins or shRNAs (left) for 72 hours. Numbers indicate percent dye-positive cells in bracketed region. Frequency of CellTrace Violetlo cells among dye-positive T cells (n=6 per genotype) (right). (H) Percentage of BrdU positive, activated Slfn2−/− splenic T cells expressing the indicated proteins or shRNAs for 48 hours, assessed by flow cytometry (n=6 per genotype). P-values were determined by Student’s t test (n.s., not significant, *P<0.5, **P<0.01, ***P<0.001). Data are representative of two (A and E) or three (C, F to H) independent experiments, and error bars indicate SD.

