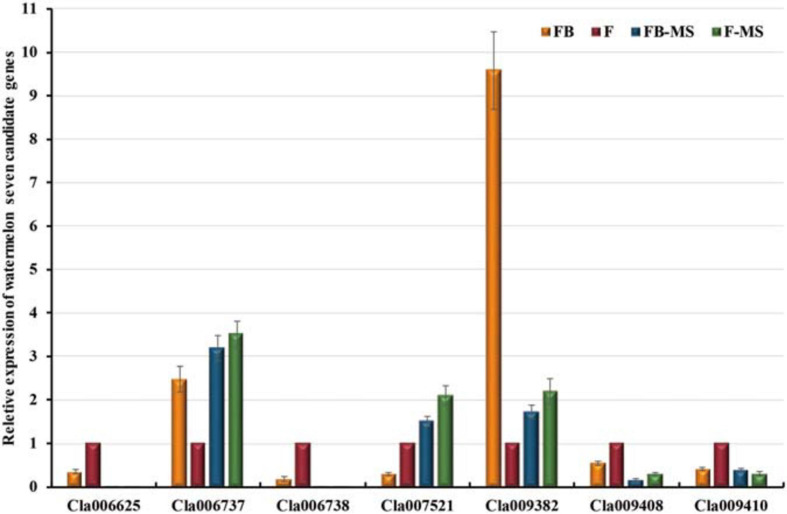
FIGURE 5.
Relative expression levels of seven candidate watermelon genes. The presented data are the average values of six independent measurements. The error bars represent the standard deviation of the mean. FB, flower bud; F, flower; FB-MS, flower bud of male-sterile plants; F-MS, flower of male-sterile plants.

