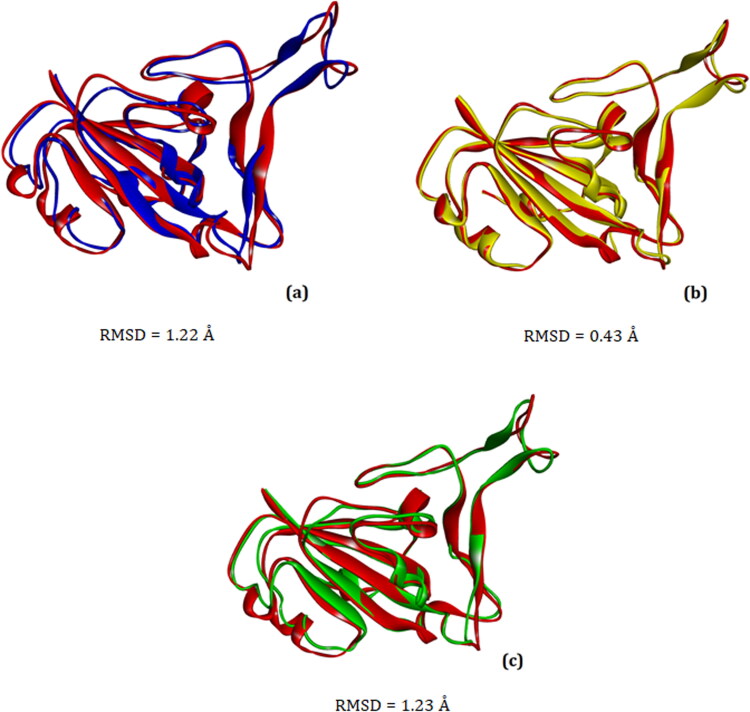
Figure 2.
Superimposed conformations of the spike glycoproteins after molecular docking simulations with ACE2. (a) Native (control) spike (red) and E484K variant (blue), (b) Native spike (red) and N501Y variant (yellow), (c) Native spike (red) and multiple (K417N + E484K + N501Y) spike variant (green). Note that the three spike variants show some conformational change relative to control. Figures were generated with Discovery Studio v16. RMSD: Root-mean-square deviation.

