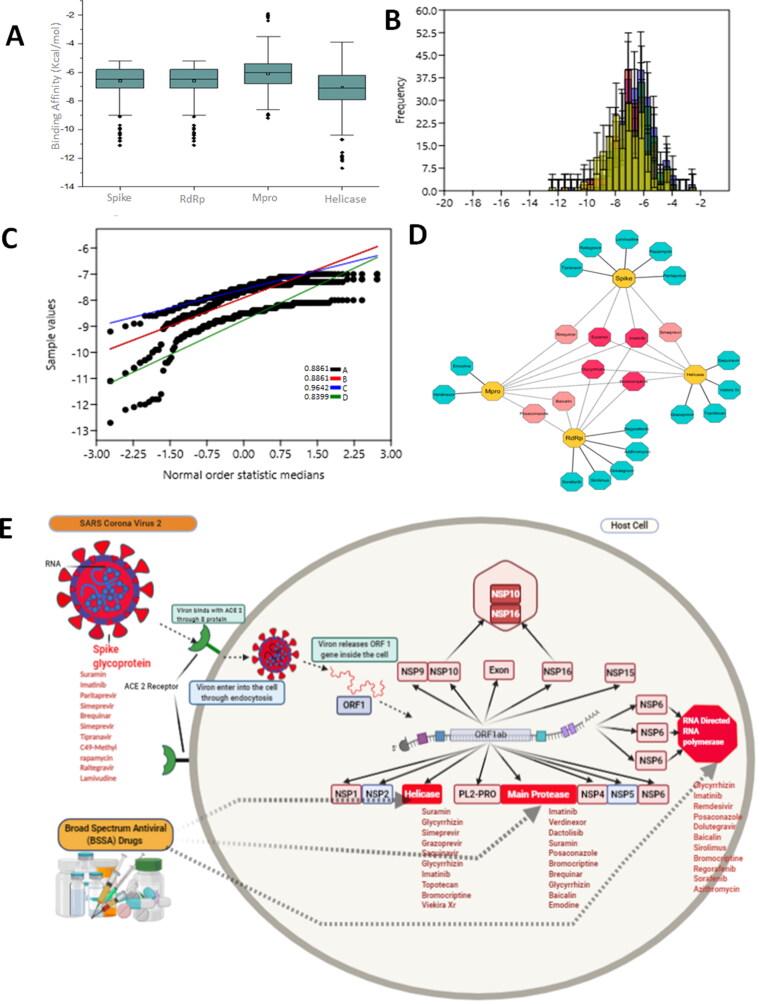
Figure 3.
Virtual screening of potential BSAAs against spike, RdRp, Mpro and helicase. (A) Box plot representation of binding affinities of BSAAs for four different groups with 95% confidence interval, the outliers are shown in black sphere (B) Histogram for four different groups with fit curve (C) Normal probability plot for spike, RdRp, Mpro and Helicase with correlation coefficient values. (D) Drug target interaction of top ten shortlisted drugs. Deep pink nodes represent drugs with more than 3 targets and light pink with two target molecules. While blue nodes represent those BSAAs that showed affinity towards a single target molecule.

