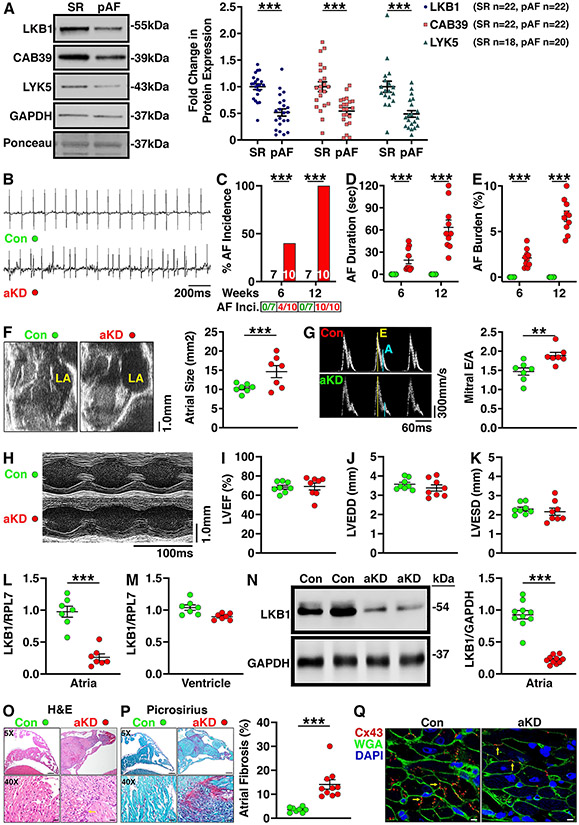
Figure 1.
A) Representative Western blot images and quantification showing the protein expression levels of LKB1, CAB39, and LYK5 in right-atrial appendage samples from patients with paroxysmal AF (pAF; n=22) vs controls in sinus rhythm (SR; n=22). Data are expressed as fold change of the respective controls in SR vs GAPDH. B) Representative telemetry ECG tracings in 8-week-old LKB1FL/FL mice that received AAV9-ANF-mCherry (control mice; Con; n=7) or AAV9-ANF-Cre vector to induce atrial-specific knockdown of LKB1 (aKD; n=10). ECG tracings show sinus rhythm in the control mouse and an episode of spontaneous AF in the LKB1-aKD mouse, respectively. Summary graphs showing AF incidence (number of mice positive for AF divided by total number of mice tested is shown below the bars; C), duration of the longest AF episode (D), and burden of AF (defined as time in AF divided by total time period analyzed, including 1 hour at nighttime and 1 hour during daytime), (E) at 6 and 12 weeks in control and LKB1-aKD mice. F) Representative B-mode echocardiogram images and interleaved scatter plots showing increased atrial size in LKB1-aKD (n=7) vs control mice (n=7). G) Doppler recordings showing mitral valve flow and quantification of the E/A ratios in 12-week-old control (n=7) and LKB1-aKD mice (n=7) revealing increased mitral valve E/A (MVE/A) ratios in LKB1-aKDA mice. H) Representative M-mode echocardiograms of the left ventricle (LV) of control and LKB1-aKD mice. Interleaved scatter plots showing I) preserved left ventricular ejection fraction (LVEF), J) unaltered LV end-diastolic diameter (LVEDD), and K) unaltered LV end-systolic diameter (LVESD) in 12-week-old LKB1-aKD mice (n=8) compared with controls (n=8). L-M) Summary scatter plots showing expression of LKB1 mRNA (normalized to RPL7) in atria (L) and ventricles (M) of LKB1-aKD (n=7) and control mice (n=7). N) Representative western blot images and quantification showing reduced LKB1 protein expression levels in atrial tissues from LKB1-aKD (n=10) vs control mice (n=10). O) Representative images of H&E staining (left) showing cellular infiltration (arrow) in atria of LKB1-aKD (n=10) vs control mice (n=8). P) Representative images of Picrosirius red staining (left) and quantification of interstitial fibrosis (right) of atrial sections from LKB1-aKD (n=10) vs control mice (n=8). Q) Representative images of immunofluorescence staining showing Cx43 (red; arrows), WGA (green) and DAPI (blue) in atrial sections from LKB1-aKD vs control mice. Data are represented as average±SEM. P values were determined by unpaired Mann-Whitney test (panels A, D, E, F, G, L, M, N, and P), Fisher's exact test (C). **P<0.01; ***P<0.001.

