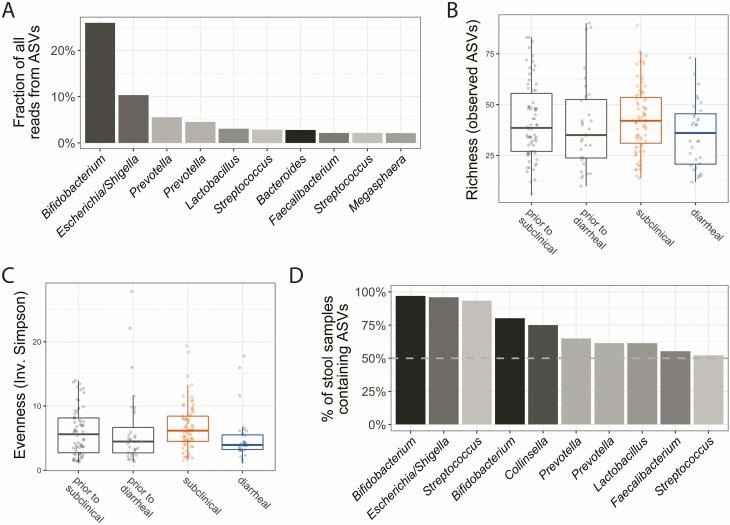
Figure 3.
Microbiome samples were highly variable. A, Most abundant amplicon sequence variants (ASVs) in the study. Only the top 10 most abundant ASVs are shown; the abundance of these common ASVs per sample is also represented in Supplementary Figure 3. Nearly 25% of all reads were assigned to an ASV in the Bifidobacterium genus. B, Richness of each sample, or the number of ASVs present in a sample, was not significantly different across sample groups. B and C, Each box represents the median (inner line), 25th percentile, and 75th percentile. Upper whiskers extend from the top of the box to the largest value within 1.5 times the interquartile range (distance between 25th and 75th percentile), and the lower whisker extends to the smallest value within 1.5 times the interquartile range. C, Evenness was also minimally different across sample groups. Evenness is a diversity metric calculated to represent how many different species are present and how well distributed those species are across samples; it is calculated using the inverse Simpson index. No significant differences in evenness was observed among any comparisons of clinical type (2-way analysis of variance with multiple testing correction via Tukey honest significant difference). D, Fraction of all samples containing a particular ASV, ordered by from highest to lowest. Very few ASVs were detected in many samples; however, almost all samples contain the most common Bifidobacterium ASVs.

