
Fig. 5.
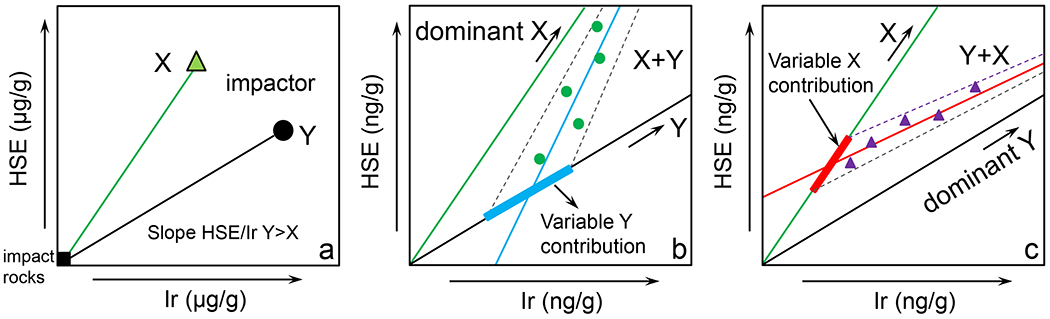
Schematic illustration of the mixing HSE versus Ir trends between the HSE-rich impactor(s) and the HSE-free lunar pristine rocks. For a given impact melt rock with linear trends and zero y-intercepts, this indicates contamination of a single dominant impactor as shown by the green (X) or black (Y) line in each panel; here (a) it is assumed that HSE/Ir ratios of X are greater than those of Y. In this case, the averaged 187Os/188Os and regressed HSE/Ir ratios can be used to precisely estimate the relative composition of the meteoritic impactor X or Y. For one impact rock with scattered trends and non-zero y-intercepts, this indicates incorporation of multiple impactor impactors. Assuming that there are two impactors X and Y, if X, compared to Y, imparts the greater proportion of HSE into the impact melt, this would lead to the creation of HSE versus Ir trends with scatter primarily controlled by the variable HSE contribution from Y, as well as negative y-intercepts (b). If Y is the dominant impactor imparting the greater proportion of HSE, this would cause HSE versus Ir trends with scatter and positive y-intercepts (c). It should be noted that efficient homogenization of multiple impactor components into melt rocks can possibly generate linear HSE versus Ir trends with zero y-intercepts as a single impactor (Fischer-Gödde and Becker, 2012). More details are provided in the text.