. 2021 Aug 26;23(35):19511–19524. doi: 10.1039/d1cp01628h

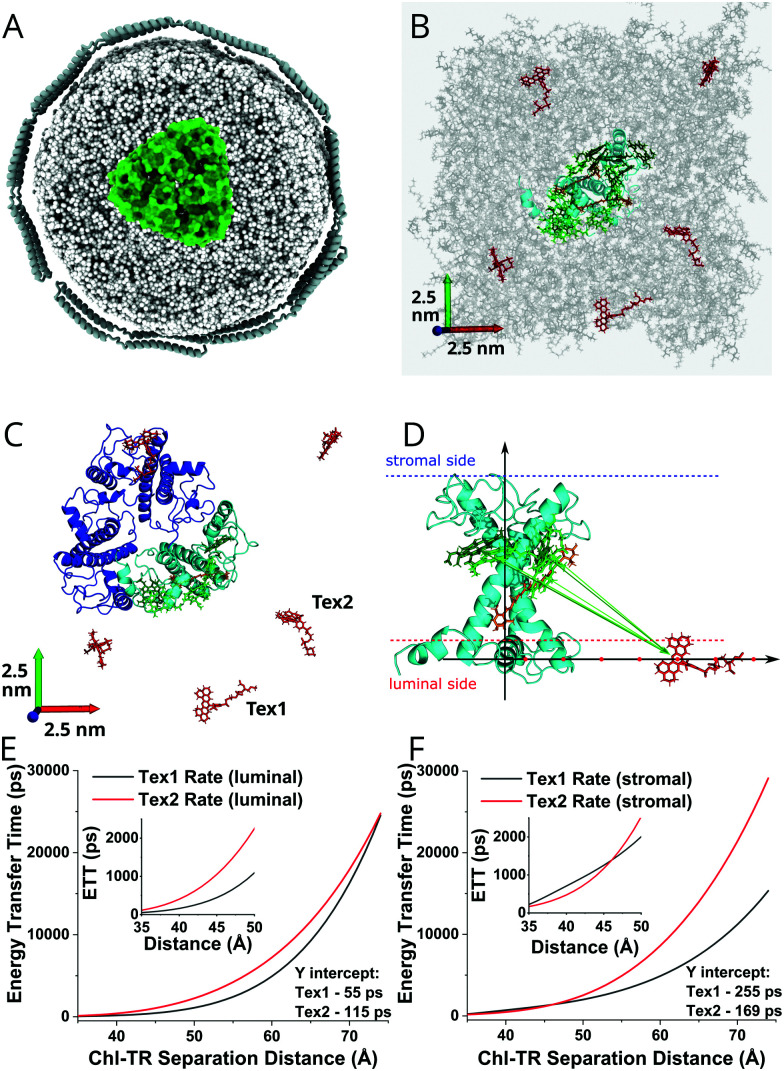
Fig. 5. (A) Cartoon of our lipid nanodisc system (top-down view) showing an LHCII trimer (green), surrounded by lipids (light grey), enclosed within the belting proteins (dark grey). This cartoon is approximately to scale. (B) Molecular dynamics model of the TR–LHCII-lipid system (top-down view) at the start of the simulation, t = 0. Shown are approximately 500 DOPC lipids (grey), 5 Texas Red (red), one LHCII monomer (polypeptide in cyan, Chls in green, carotenoids in orange). Only the most relevant pigments are displayed for clarity. (C) Representation of the system from (B), except overlaid with the position of a possible LHCII trimer. The two TR molecules of interest that were chosen for further analysis are noted (Tex1 and Tex2). Only the protein backbone and pigments at the extremity of the protein, which we expect to interact with TR, are shown for clarity. (D) Side-on view of the structural model demonstrating the simulated change in lateral position of the TR molecule relative to LHCII incorporated into the lipid bilayer. (E and F) Graphs showing the TR-to-Chl transfer times (k−1) as a function of separation distance as the TR position is varied as shown in (D), for the Chla612-to-Tex1 pair (black line) or the Chla612-to-Tex2 pair (red line). This was computed from the resonance couplings and the spectral overlaps for all likely transitions, following Förster theory as detailed in ESI, 2.24. (E) and (F) show the transfer rates calculated from TR located on the luminal and stromal sides of the membrane, respectively. The inset graphs magnify the low-distance regime for increased clarity.

Fig. 5