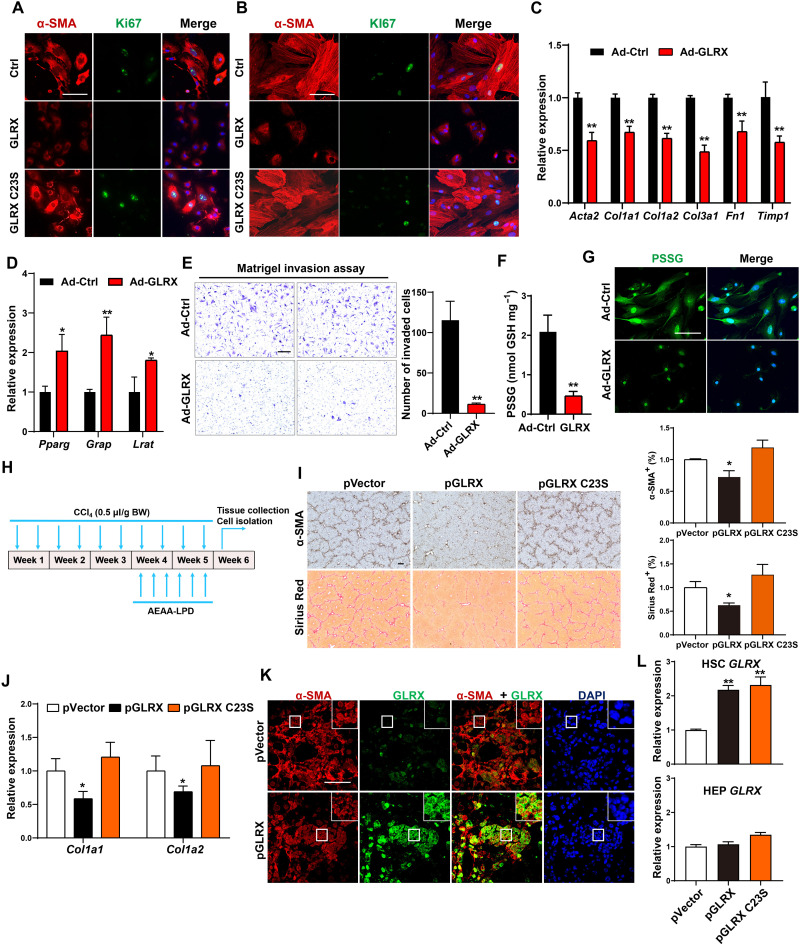
Fig. 5. Overexpression of GLRX, but not its enzyme-dead mutant, inhibits HSC activation and liver fibrosis.
(A and B) Immunofluorescence staining of α-SMA (red) and Ki67 (green) in primary mouse (A) and human (B) HSCs infected with Ad-GLRX or Ad-GLRX C23S. Nuclei (blue) and DAPI. Scale bar, 100 μm. (C to G) Primary mouse HSCs were infected with Ad-GLRX or Ad-Ctrl 1 day after isolation and culture-activated for an additional 4 days. mRNA expression of activated (C) and quiescent (D) HSC marker genes, Matrigel invasion assay (E), PSSG level detected by enzymatic recycling assay (F), and in situ visualization of PSSG (G) (n = 3) are shown. (H to L) Mice were subjected to the nanoparticle regimen in the CCl4 model as outlined in (H). α-SMA immunostaining and Sirius Red staining with quantifications on the right (n = 4) (scale bar, 200 μm) (I), hepatic mRNA expression of Col1a1 and Col1a2 (n = 4) (J), and immunofluorescence staining of α-SMA and GLRX in fibrotic livers are shown. Magnified areas of corresponding smaller boxes are shown in the larger boxes. Scale bar, 100 μm (K). GLRX mRNA expression in primary HSCs and HEPs isolated at the end of experiments (n = 3) (L). Data are means ± SD. *P < 0.05 and **P < 0.01. Data in (C) to (F) were analyzed by two-tailed Student’s t test. Data in (I), (J), and (L) were analyzed by one-way analysis of variance with the Tukey’s post hoc test.

