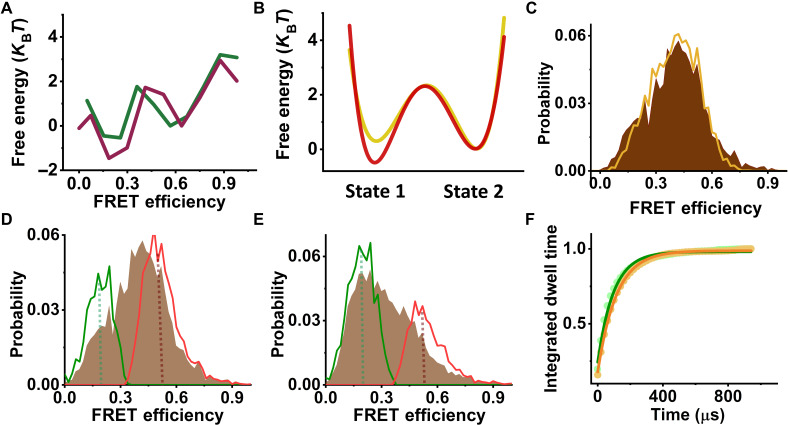
Fig. 3. Analysis of PL2 conformational dynamics.
(A) Free-energy profiles of PL2, as obtained from H2MM analysis. Pore-loop FRET data in the presence of 2 mM ATP and either without (green line) or with 20 μM κ-casein (purple line) were analyzed as discussed in Methods using nine sequentially connected states. Two well-defined minima are observed, indicating a two-state system. (B) Line plots of the effective free-energy profiles as obtained from a two-state H2MM from data measured either without (yellow line) or with 20 μM κ-casein (red line). The barrier heights in this figure were calculated using the Arrhenius equation with a pre-exponential factor of 105 s−1. (C) A recolored FRET-efficiency histogram of PL2 (orange), obtained from analysis with a two-state model, matches well the original histogram (brown). (D and E) Segmentation analysis. Following the two-state H2MM analysis, segmented FRET-efficiency histograms were calculated according to the procedure outlined in Methods to obtain the distributions of the separate states. In each histogram, the green line is the low FRET-efficiency segmented population, and the red line is the high FRET-efficiency segmented population. Original histograms are plotted in brown. Dashed lines point to FRET-efficiency values of the two states obtained from the analysis. (D) With ATP only and (E) with ATP and 20 μM κ-casein. (F) Dwell time analysis. Integrated dwell-time distributions were calculated on the basis of the results of the two-state H2MM analysis as described in Methods. State 1 is shown as green dots, and state 2 is shown as orange dots. Green and orange solid lines are fits to single-exponential functions, and the obtained rates are listed in Table S3.

