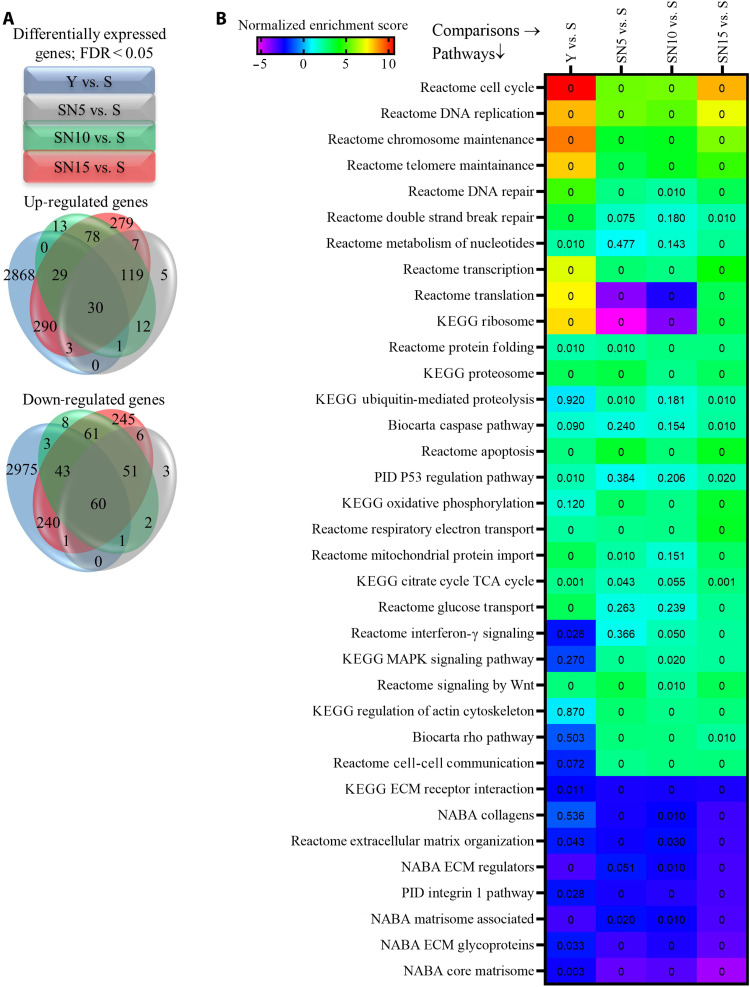
Fig. 2. Genome-wide RNA-seq and GSEA.
(A) Venn diagram of differentially expressed (DE) genes with false discovery rate (FDR) < 0.05 showing the distribution of overlapping or unique DE genes among different conditions. (B) A concise heatmap of representative pathways that are significantly enriched either at 5, 10, or 15 days after NANOG expression (FDR is written inside the cells; the FDR < 0.001 is depicted as 0). PID, Pathway Interaction Database.

