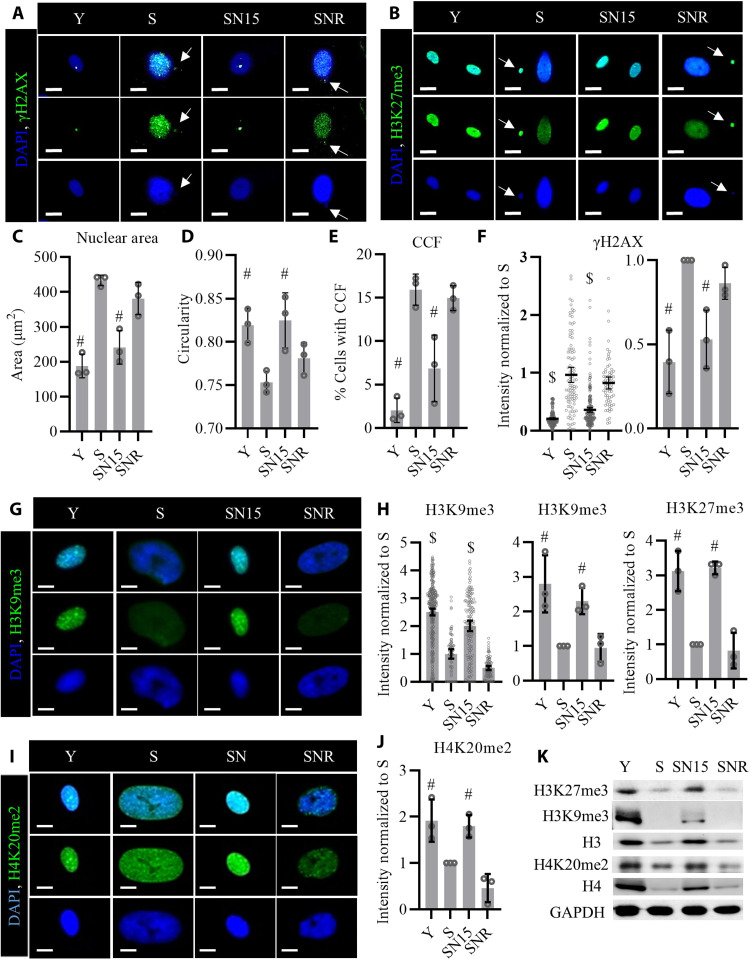
Fig. 3. NANOG expression restores nuclear integrity and heterochromatin marks in senescent cells.
(A and B) Immunostaining for phosphorylated form of histone H2AX (γH2AX) and H3K27me3. White arrows point to CCFs positive for γH2AX and H3K27me3. Scale bars, 20 μm. (C and D) Quantification of the nuclear area and nuclear circularity, data shown as means ± SD for three donors. (E) Quantification of percent cells positive for CCF. Data shown as means ± SD for three donors. (F) Quantification of γH2AX intensity per cell; data shown as means ± 95% CI for >100 cells for each condition in one representative experiment and means ± SD for three donors. (G) Immunostaining for heterochromatin mark H3K9me3. Scale bars, 10 μm. (H) Quantification of the H3K9me3 and H3K27me3 intensity. Data shown as means ± 95% CI for >100 cells for each condition in one representative experiment and means ± SD for three donors. (I) Immunostaining for the chromatin mark H4K20me2. Scale bars, 10 μm. (J) Quantification of H4K20me2 intensity. Data shown as means ± SD for three donors. (K) Western blotting analysis of the histone marks. GAPDH, glyceraldehyde-3-phosphate dehydrogenase. $ denotes P < 0.05 as compared to all other samples. # denotes P < 0.05 as compared to S.

