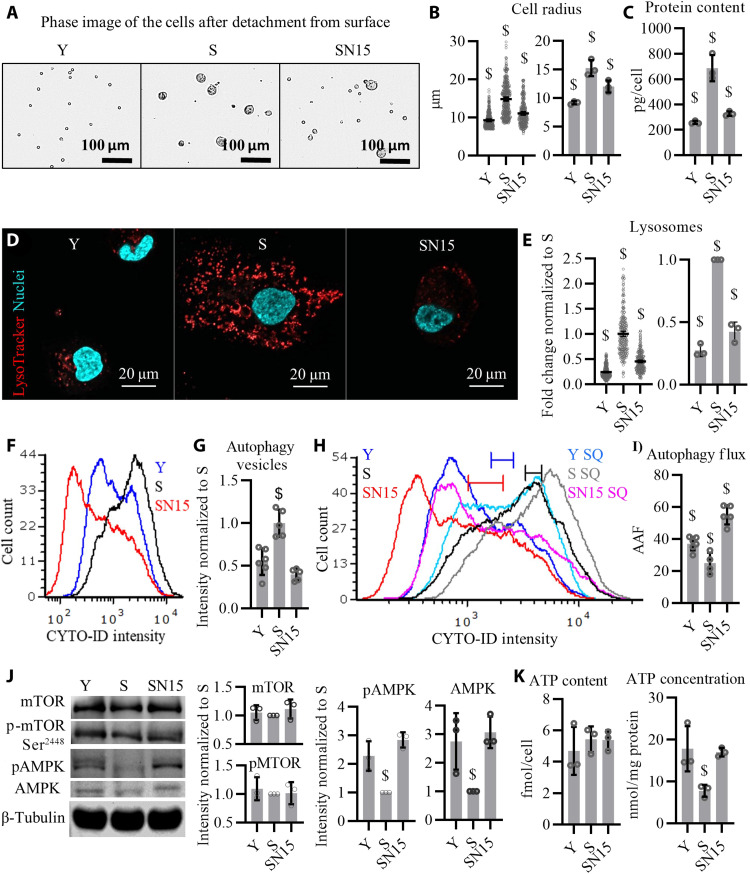
Fig. 5. NANOG expression restores autophagy.
(A) Phase images of the myoblasts detached from the surface. (B) Quantification of cell radius; data shown as means ± 95% CI for 300 cells per condition in one representative experiment and means ± SD for three donors. (C) Total intracellular protein content; data shown as means ± SD for three donors. (D) LysoTracker staining showing lysosomes. (E) Quantification of LysoTracker stain; data shown as means ± 95% CI for 300 cells per condition in one representative experiment and means ± SD for three donors. (F) Flow cytometry histogram of cells stained with CYTO-ID, a dye that binds to autophagy vesicles. (G) Quantification of the mean fluorescence intensity (MFI); data shown as means ± SD of five independent experiments. (H) Flow cytometry histogram of cells stained with CYTO-ID before or after starvation with chloroquine (SQ) treatment. (I) Autophagy activity factor (AAF % = 100 × (MFISQ − MFIcontrol)/MFISQ), a metric of autophagy flux; data shown as means ± SD for n = 5 independent experiments. (J) Western blotting analysis for quantifying the total protein and phosphorylation of mTOR (S2448) and AMPKα (T172). β-Tubulin serves as a housekeeping protein for loading control. (K) Total cellular ATP content reported as femtomole per cell and ATP concentration reported as nanomole per milligram of protein; data shown as means ± SD for three donors. $ denotes P < 0.05 as compared to all other samples.

