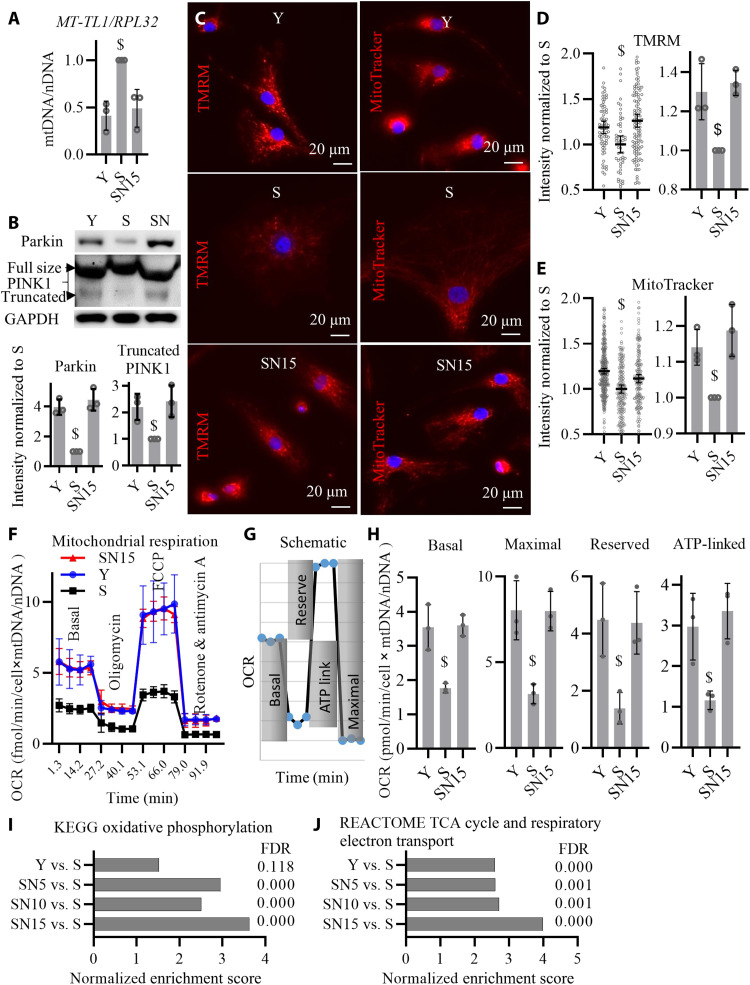
Fig. 6. NANOG improves mitochondrial health.
(A) Quantitative real-time PCR quantification of mtDNA relative to nDNA (mtDNA/nDNA) as measured by primers specific to mitochondrial gene MT-TL1 and nuclear gene RPL32. Data shown as means ± SD for three donors. (B) Western blotting quantification of Parkin and PINK1 proteins. (C) Representative images of tetramethylrhodamine methyl ester (TMRM) and MitoTracker live stains corresponding to mitochondrial Δψ. (D and E) Quantification of TMRM and MitoTracker intensity per cell; data shown as means ± 95% CI for 200 to 300 cells per condition in one representative experiment and means ± SD for three donors. (F) Measurements of oxygen consumption rate (OCR) using Seahorse extracellular flux analyzer. (G) Schematic for the measurements of basal, maximal, reserved, and ATP-linked respiration rates. (H) Calculations of the basal, maximal, reserved, and ATP-linked respiration rates; data shown as means ± SD for three donors. (I and J) GSEA bioinformatics pathway analysis of RNA-seq shows enrichment of oxidative phosphorylation pathway as well as TCA cycle and respiratory electron transport pathway by NANOG expression for 5, 10, and 15 days in senescent cells. Data shown as means and FDR values for three donors. $ denotes P < 0.05 as compared to all other samples.

