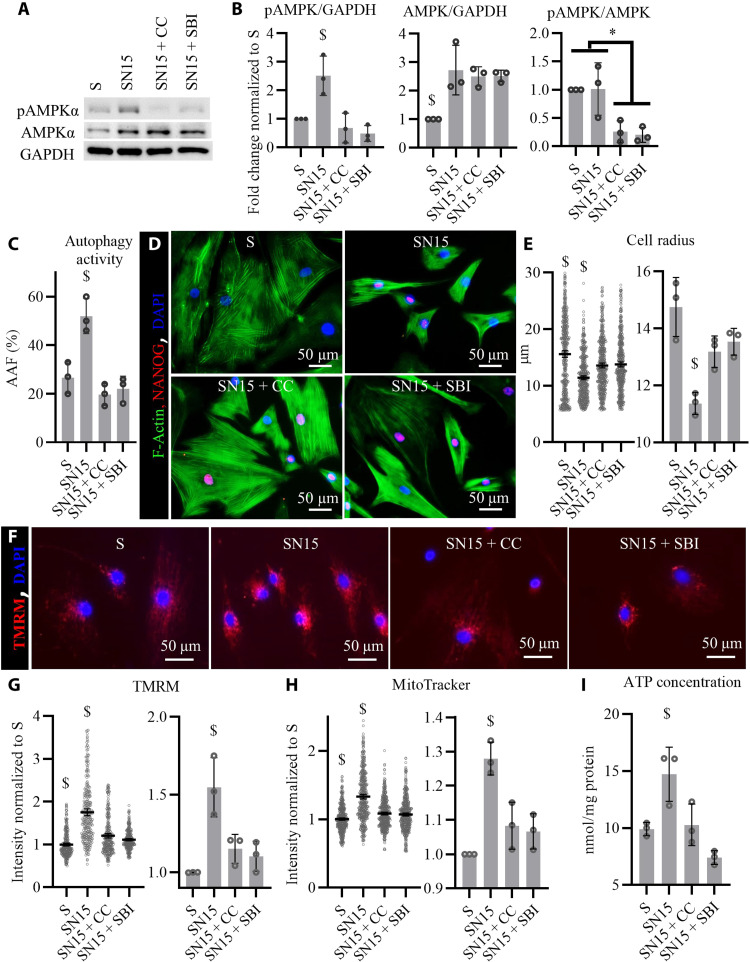
Fig. 7. Inhibition of AMPK abrogated the up-regulation of autophagy and mitochondrial function by NANOG.
AMPKα was inhibited along with NANOG expression in senescent myoblasts for 15 days. (A) Western blots against pAMPKα (T172) and total AMPKα, having GAPDH as a loading control. (B) Quantification of Western blots showed that NANOG expression significantly up-regulated the pAMKP/GAPDH by increasing AMPK/GAPDH levels, while addition of compound C (CC; 1 μg/ml) or SBI decreases the phosphorylated form of AMPKα without changing the total levels of AMPKα. Data shown as means ± SD for three independent Western blots. (C) Calculation of AAF suggests that AMPK activation is essential to the up-regulation of autophagy in SN cells. Data shown as means ± SD for three independent repeats. (D) Representative images of F-actin and NANOG immunostaining showing changes in cellular size. (E) Quantification of cell radius showing AMPKα significantly affects the decrease in cellular size by NANOG expression. Data shown as means ± 95% CI for 400 cells per condition in one representative experiment and means ± SD for three donors. (F) Representative images of TMRM staining corresponding to Δψ. (G and H) Quantification of TMRM and MitoTracker intensity as a measure of mitochondrial membrane potential. Data shown as means ± 95% CI for 300 cells per condition in one representative experiment and means ± SD for three donors. (I) Intercellular ATP concentration suggests that AMPK activation is essential to the effects of NANOG on cellular energetics. Data shown as means ± SD for three donors. $ denotes P < 0.05 as compared to all other samples. * denotes P < 0.05 between the two groups.

