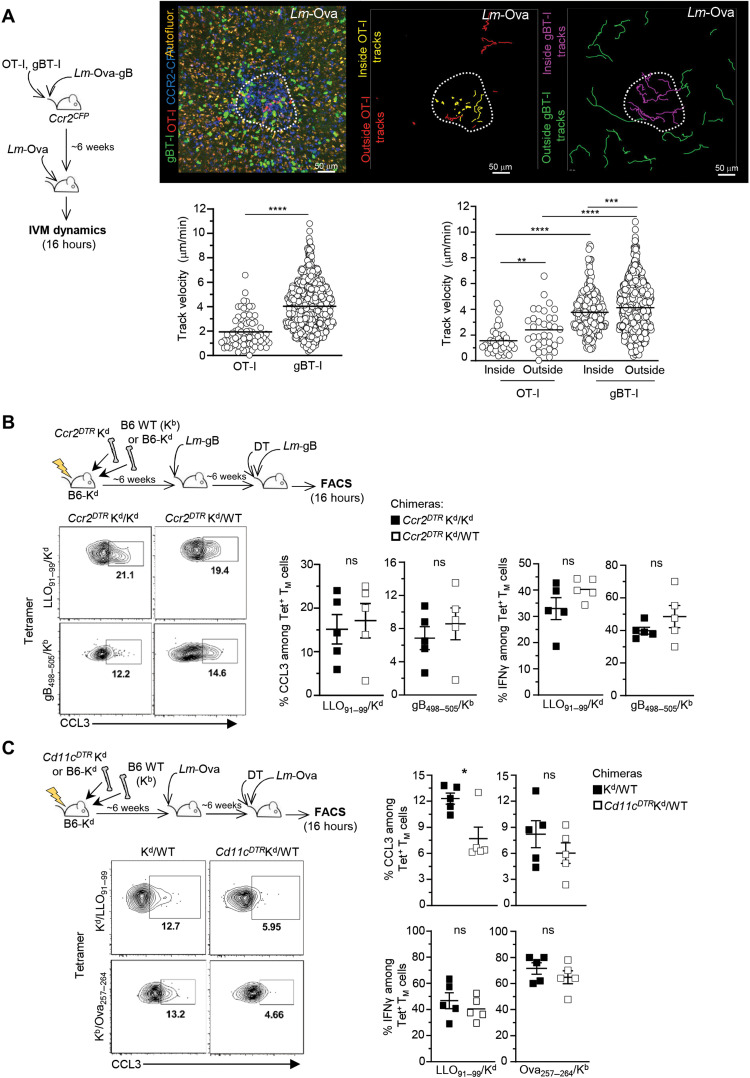
Fig. 5. Memory CD8+ T cells arrest upon cognate Ag recognition presented by DCs but not CCR2+Ly6C+ monocytes.
(A) Ccr2CFP mice cotransferred with naïve OT-I Td+ and gBT-I GFP+ cells and immunized with 104 Lm-Ova-gB were challenged ~6 weeks later with 106 Lm-Ova, and spleens from live mice were exposed and imaged 16 hours later using IVM imaging. A representative image (left) of OT-I (red) and gBT-I (green) TM cell localization in a cluster (white dotted line) of CCR2+Ly6C+ monocytes (blue) is shown. Autofluorescence appears in yellow. Also shown (center and right images) are OT-I TM cell tracks (outside, red and inside, yellow) and gBT-I TM cell tracks (outside, green and inside, purple) inside/outside the same cluster of CCR2CFP monocytes. Graphs represent the speed of individual OT-I and gBT-I TM cells in the monocyte cluster area (left) and inside/outside the cluster. (B and C) Lethally irradiated (1200 rads) B6-Kd recipient mice were reconstituted with (B) B6-Kd or WT B6 (Kb) and Ccr2DTR Kd BM or (C) Cd11cDTRKd or Kd and WT B6 BM. Six weeks after reconstitution, mice were immunized with 104 Lm-gB (B) or Lm-Ova (C) and, 6 weeks later, challenged with 106 Lm-gB 12 hours after DT treatment. Endogenous CD8+ TM cells were monitored using LLO91–99/Kd, gB498–505/Kb, or Ova257–264/Kb Tet. Graphs show the expression of CCL3 and IFNγ among Tet+ cells after challenge. Each symbol corresponds to one individual mouse in one of two replicate experiments, and P values are shown. *P < 0.1, **P < 0.01, ***P < 0.001, and ****P < 0.0001.

