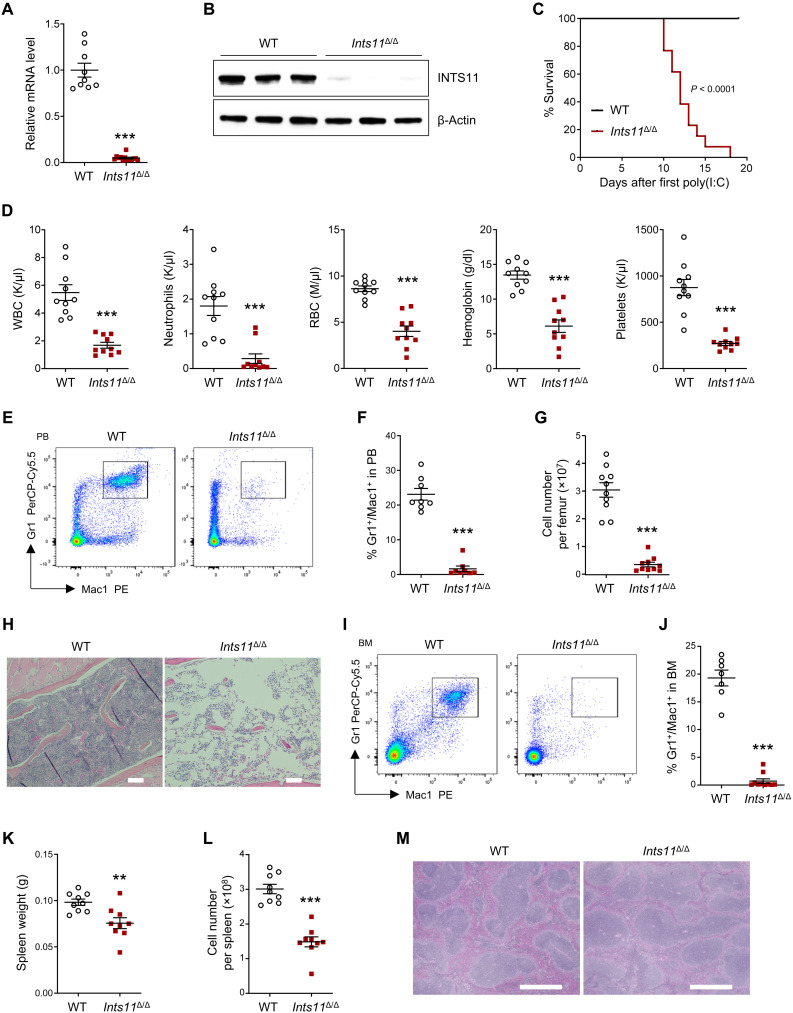
Fig. 2. INTS11 deletion leads to hematopoietic failure.
(A) Ints11 mRNA levels in BM Lin−cKit+ (LK) cells from WT (n = 9) and Ints11Δ/Δ mice (n = 13) 72 hours after first poly(I:C) injection. (B) INTS11 protein levels in LK cells from WT and Ints11Δ/Δ mice. (C) Kaplan-Meier survival curve representing percent survival of Ints11Δ/Δ mice following poly(I:C) injection. Log-rank (Mantel-Cox) test; WT, n = 10; Ints11Δ/Δ, n = 13. (D) PB counts of WT and Ints11Δ/Δ mice (n = 10 per genotype). WBC, white blood cells; RBC, red blood cells. (E) Flow cytometric analysis of myeloid cells in PB from WT and Ints11Δ/Δ mice 12 days after first poly(I:C) injection. (F) Frequencies of Gr1+/Mac1+ cells in PB from WT and Ints11Δ/Δ mice (n = 8 per genotype). (G) BM cellularity of WT and Ints11Δ/Δ mice (n = 10 per genotype) 12 days after poly(I:C) injection. (H) Representative hematoxylin and eosin (H&E) staining of bone sections. Scale bar, 100 μm. (I) Flow cytometric analysis of myeloid cells in BM from WT and Ints11Δ/Δ mice 12 days after poly(I:C) injection. (J) Frequency of Gr1+/Mac1+ cells in BM from WT (n = 7) and Ints11Δ/Δ mice (n = 10). (K and L) Weight (K) and cellularity (L) of the spleen from WT and Ints11Δ/Δ mice (n = 9 per genotype). (M) Representative H&E staining of spleen sections. Scale bar, 10 μm. Data are means ± SEM. Unpaired Student’s t test: **P < 0.01 and ***P < 0.001.

