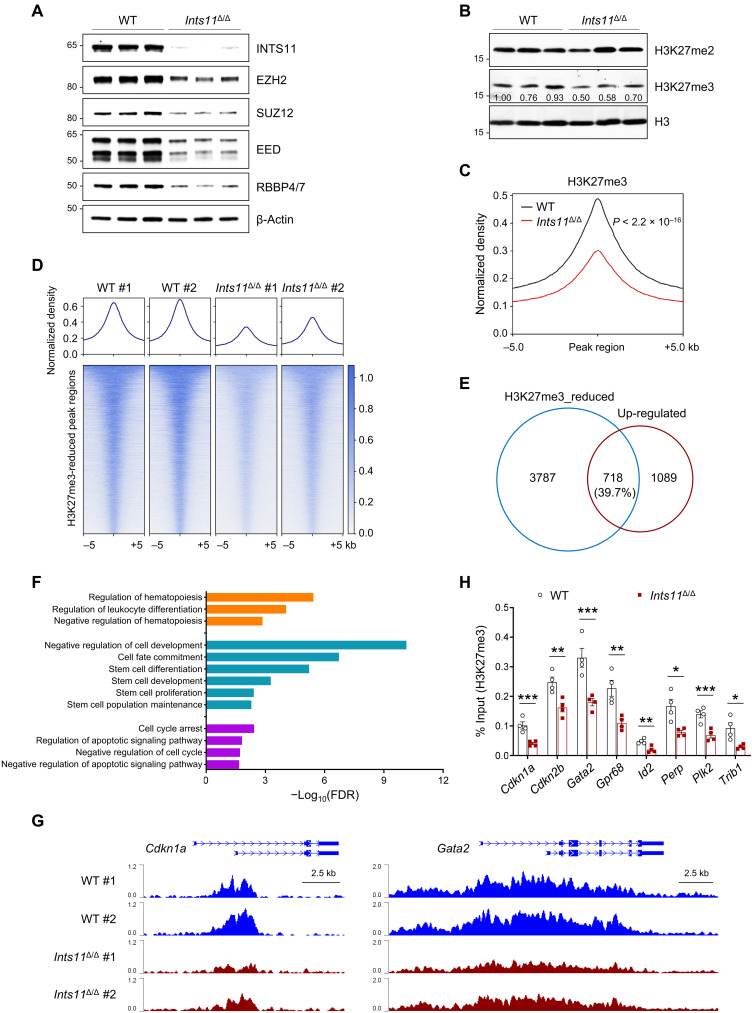
Fig. 7. Decreased H3K27me3 enrichment contributes to the up-regulation of gene expression in Ints11-deficient LK cells.
(A) Western blot analysis of indicated members of the PRC2 complex in LK cells from WT and Ints11Δ/Δ mice 72 hours after poly(I:C) injection. (B) Western blot showing the levels of H3K27me2 and H3K27me3 in Ints11Δ/Δ LK cells. H3 was used as a loading control. (C) Global levels of H3K27me3 at peaks and 5-kb regions surrounding the peak midpoint. The coverages were normalized by the sequencing depth and averaged in two biological replicates. P value was calculated by paired Student’s t test. (D) Heatmaps of normalized H3K27me3 ChIP-seq read densities centered on the midpoints of 5985 H3K27me3-decreased regions. Each row represents a single region. (E) Venn diagram showing the overlap between genes with reduced H3K27me3 and up-regulated genes in Ints11Δ/Δ LK cells. The number of genes in each section of the diagram is shown. (F) Functional enrichment analysis for 718 overlapping genes in (E). Representative significantly enriched pathways were displayed (FDR < 0.05). (G) Normalized H3K27me3 signals on the Cdkn1a and Gata2 gene loci. (H) ChIP-qPCR verified the reduction of H3K27me3 occupancies at the promoter regions of the genes in Fig. 4F (n = 4 per genotype). Data are means ± SEM. Unpaired Student’s t test: *P < 0.05, **P < 0.01, and ***P < 0.001.

