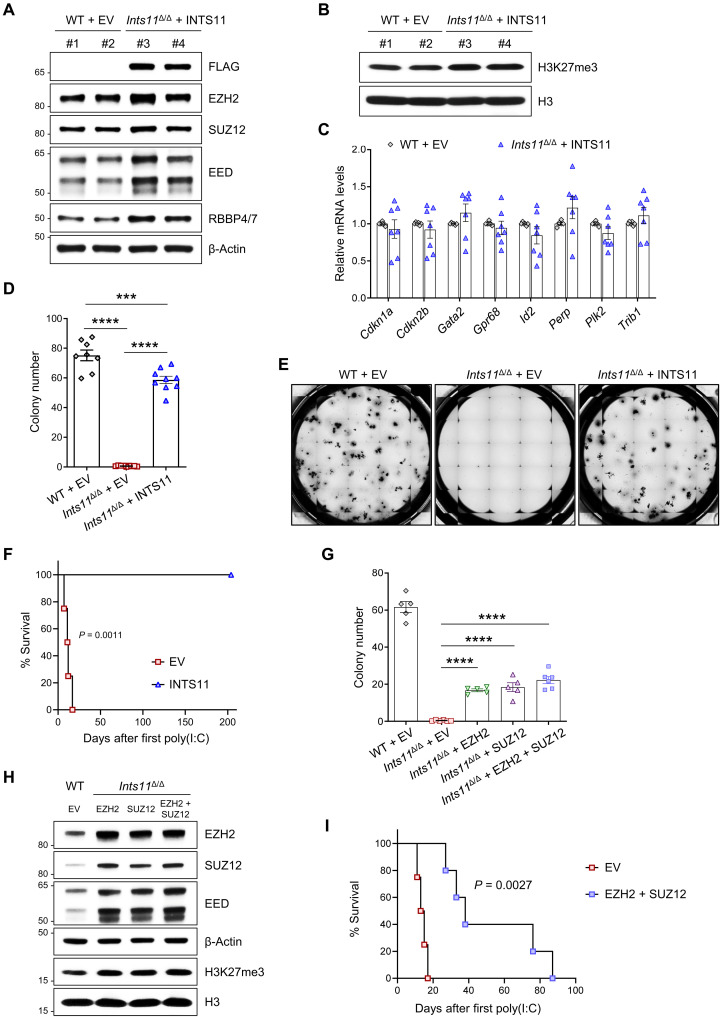
Fig. 8. Reexpression of INTS11 increases the PRC2 activity and rescues the Ints11-deficient phenotypes.
(A and B) Western blot showing the levels of PRC2 subunits (A) and H3K27me3 (B) in Ints11Δ/Δ cells transduced with FLAG-INTS11. (C) qPCR showing the expression levels of up-regulated genes (Fig. 4F) in Ints11Δ/Δ cells transduced with FLAG-INTS11. Each dot represents an individual mouse (n = 6 to 7 per group). (D) Reexpression of INTS11 increased the colony-forming capacity of Ints11Δ/Δ cKit+ cells. Each dot represents an individual mouse (n = 8 to 9 per group). (E) Representative images of colony formation for Ints11-deficient cKit+ cells transduced with FLAG-INTS11 and controls. The images were taken on the seventh day of the assay. (F) Kaplan-Meier survival analysis of recipients receiving Ints11Δ/Δ cells expressing FLAG-INTS11. Log-rank (Mantel-Cox) test; FLAG-INTS11, n = 6; EV controls, n = 4. (G) Enhanced expression of PRC2 partially restored the colony-forming capacity of Ints11Δ/Δ cKit+ cells. Each dot represents an individual mouse (n = 5 to 6 per group). (H) Western blot showing the levels of PRC2 subunits and H3K27me3 in Ints11Δ/Δ cells transduced with EZH2 and/or SUZ12. (I) Kaplan-Meier survival analysis of recipients. Log-rank (Mantel-Cox) test; EZH2 + SUZ12, n = 5; EV controls, n = 4. Data are means ± SEM. One-way analysis of variance with Tukey’s multiple comparisons test: ***P < 0.001 and ****P < 0.0001.

