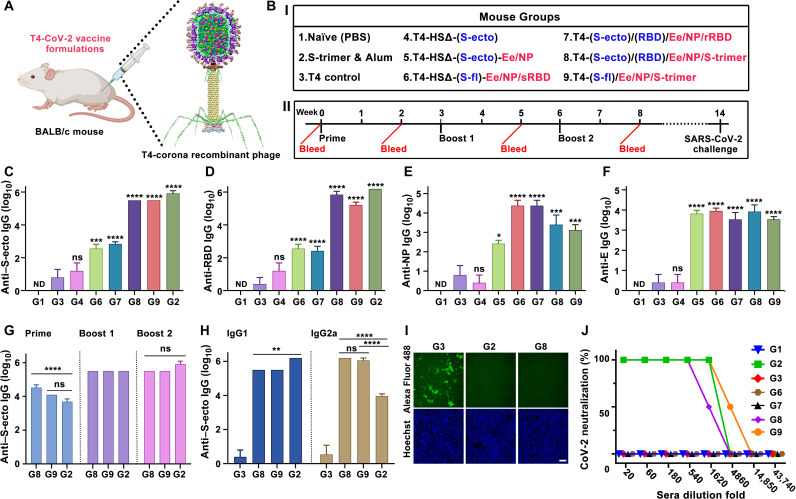
Fig. 6. Immunogenicity of T4–SARS-CoV-2 vaccine candidates in mice.
(A and B) Schematic showing BALB/c mice immunized with various T4–SARS-CoV-2 (T4-CoV-2) vaccine formulations. Photo credit: The mouse image was created with BioRender.com. (I) HSΔ indicates Hoc and Soc deletion. Blue color indicates insertion of expression cassette into T4 genome as DNA vaccine. Red color indicates capsid-displayed antigens. (II) Prime-boost immunization and challenge scheme. (C to F) Boost 2 sera (week 8 bleeding) were assessed by ELISA for antigen-specific IgG antibody titers (end point) against S-ecto (C), RBD (D), NP (E), and E (F). *P < 0.05, ***P < 0.001, and ****P < 0.0001, compared with phage control group G3. ns, not significant, P > 0.05; ND, not detected. (G and H) Comparison of anti–S-ecto IgG antibody titers (G) (****P < 0.0001) and of IgG1 and IgG2a subtype antibody titers in boost 2 sera (H) (**P < 0.01 and ****P < 0.0001). (I) Blocking of RBD binding to HEK293-ACE2 by 500× diluted sera. Scale bar, 20 μm. (J) Neutralization antibody measurements. See Materials and Methods for additional details.

