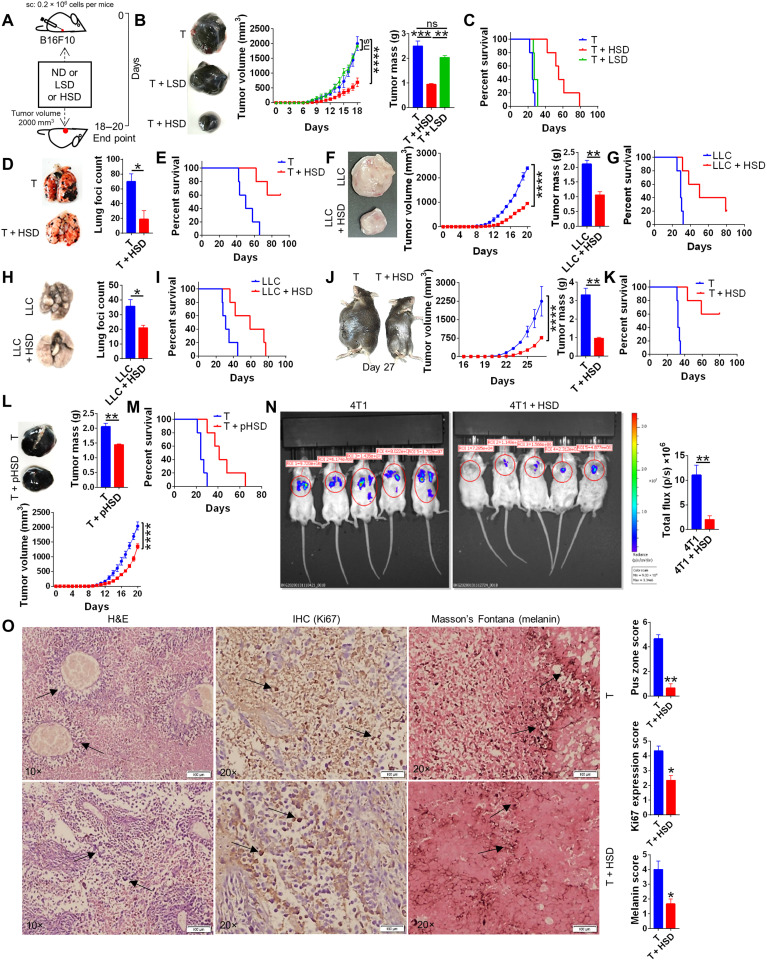
Fig. 1. HSD provides potent immunity against murine syngenic tumor.
Syngenic mouse tumor models by using subcutaneous (melanoma) or intravenous (metastasis) injections of cell lines was used to study the effect of normal salt diet (T + 0.9% NaCl), low-salt diet [T + LSD (1% NaCl above ND)], or high-salt diet [T + HSD (4% NaCl above ND)] until tumor volume reached 2000 mm3 or until animal mortality for survival curve. At the end point (when tumor volume reached ~2000 mm3), the animals were euthanized; their tumor was excised, cleaned, and imaged; and their tumor mass was recorded. For metastasis model, animals were euthanized 20 days after intravenous injections, and their lung was excised to count the number of lung foci. (A) Schematic representation of the method for (B) progression of B16 skin melanoma with different doses of salt diet and (C) survival curve of B16 melanoma animals. ns, not significant; sc, subcutaneous. B16 lung metastasis model (D) showing foci in lungs and (E) survival curve. (F and G) Carcinoma and (H and I) lung metastasis with their (G and I) survival curve, respectively, by LLC cells and (J) surgical model in which tumor from mice was surgically removed at 1000 mm3, and then the animals were put either on HSD or ND and its (K) survival curve. (L) Pretreatment model in which one group of animal was pretreated for 15 days with HSD, and then B16 melanoma was allowed to grow with ND and its (M) survival curve. (N) Lung metastasis of 4T1 luciferase cells on day 16 by in vivo imaging of luminescence. (O) Histological images of B16 melanoma on day 15: hematoxylin and eosin (H&E) stain at 10× (left), immunohistochemistry (IHC) for Ki67 at 20× (middle), and Masson’s Fontana stain at 20× (right). *P < 0.05, **P < 0.01, ***P < 0.001, and ****P < 0.0001 (Student’s t test or one-way ANOVA). Photo credit: Z. Abbas Rizvi, Translational Health Science and Technology Institute.

