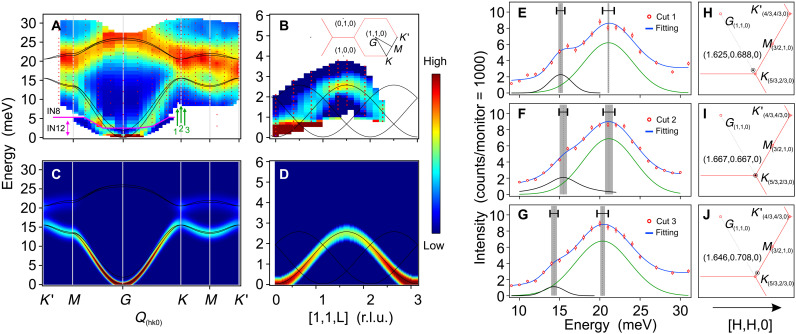
Fig. 3. Spin-wave excitations in CrGeTe3.
(A and B) Energy- and momentum-resolved neutron scattering intensity maps of magnon in CrGeTe3 along the high-symmetry directions measured at IN8 and IN12, respectively. Black solid lines are the calculated magnon dispersion curves. Inset in (B) shows the projected BZ with high-symmetry points and the scan paths in the experiments. (C and D) The corresponding calculated magnon spectra intensity maps for (A) and (B) by using the 2nd-NN DM interaction model. The calculated spectra are convolved with an energy resolution of 1 meV to compare with experimental data. (E to G) The line profiles of constant-Q energy scan at the positions of 1,2,3 marked by the green arrows in (A) near the K point Q = (5/3,2/3,0). The solid lines are the multipeak Gauss fitting results. The peak positions and the errors are indicated, respectively, by the dashed lines and the gray shadows; the corresponding energy resolutions are represented by the black horizontal bar with caps. (H to J) The actual Q positions of the cut 1, 2, and 3 are marked by black circles with center dots in the reciprocal space. The red solid lines are the BZ boundaries.

