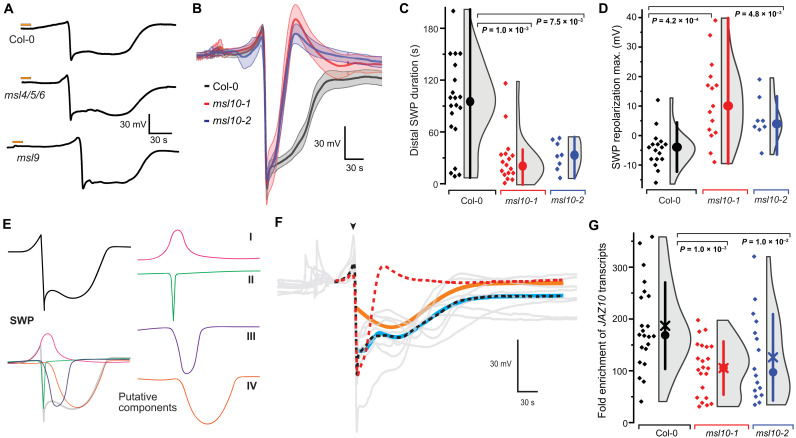
Fig. 2. Wound-induced SWPs in distal leaves of msl10 mutants.
(A) Representative SWP recordings in distal leaves after wounding (orange bars) of Col-0, msl4/5/6, and msl9 mutant plants. (B) Averaged SWP recordings aligned by derivative minima (n = 5 to 6; error bands, SEM). (C) SWP duration (median ± SEM: Col-0: 99.6 ± 11.8 s, msl10-1: 21.7 ± 7.0 s, msl10-2: 32.7 ± 5.9 s). (D) SWP repolarization maxima (median ± SEM: Col-0: −4.0 ± 1.5 mV, msl10-1: 12.5 ± 3.6 mV, msl10-2: 4.0 ± 2.7 mV; n = 8 to 17). Analysis of other SWP parameters provided in fig. S3. (E) Hypothetical model in which SWP is broken down into four distinct components, I to IV. (F) Quantitative comparison of mutant and Col-0 SWP curves. Col-0 and mutant response curves differ by a component describable through a single gamma function. Gray lines are individual wild-type (WT) response curves. The red dashed line is the mean response curve of the mutants. Combining this empirical mutant response curve with a single gamma distribution function (orange line) and a constant downshift results in an excellent fit (cyan line) to the mean of Col-0 response curves [black dashed line; root mean square error (RMSE) = 0.864, corresponding to 1.9% of the range of the data]. Fitting was done downstream of the major depolarization event (arrowhead). (G) JAZ10 mRNA levels in L13 of msl10 mutants as determined by qRT-PCR. Circle, median; ×, mean. All P values displayed were calculated using Mann-Whitney U test.

