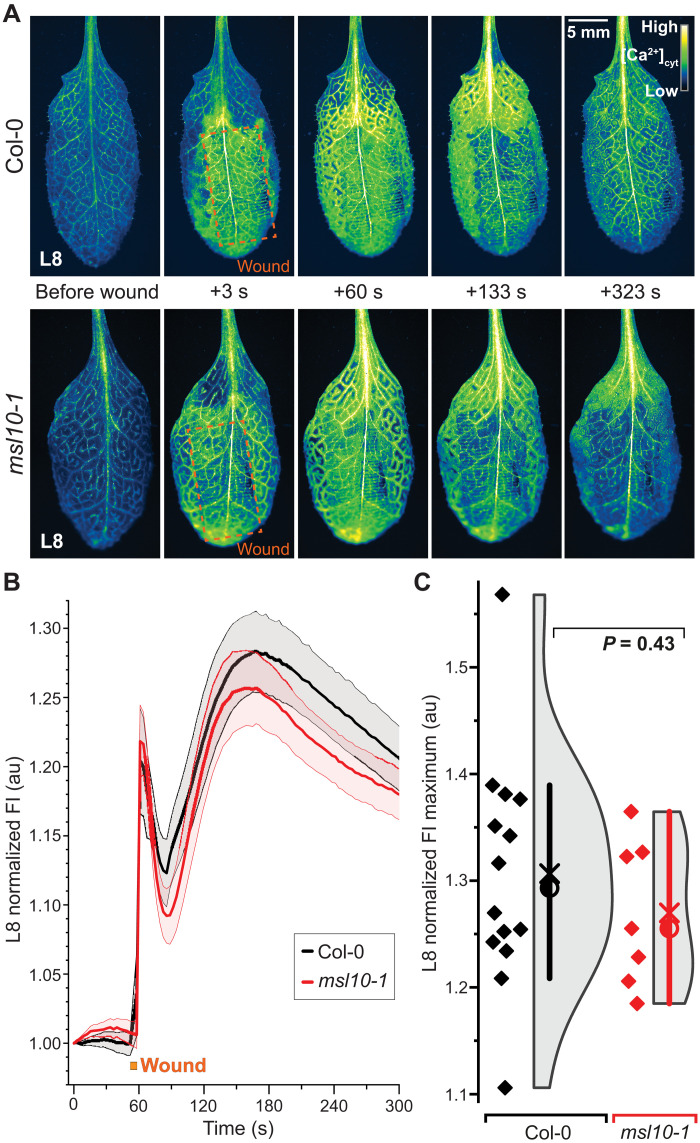
Fig. 9. Wound-induced calcium elevations in L8 measured by MatryoshCaMP6s.
(A) Pseudo-color images of indicated time points before and after wounding L8 of Col-0 and msl10-1 plants expressing MatryoshCaMP6s. Wounded site is marked by orange box. (B) Averaged whole-L8 responses normalized to initial FI (FIt/FI0) (error bands, SEM; n = 7 to 14). (C) Quantification and statistical analysis of maximal FI from individual traces shown in (B). Circle, median; ×, mean. Violin plots and statistics as in Fig. 1. Displayed P values calculated by Mann-Whitney U test (n = 7 to 14). See movies S5 and S6.

