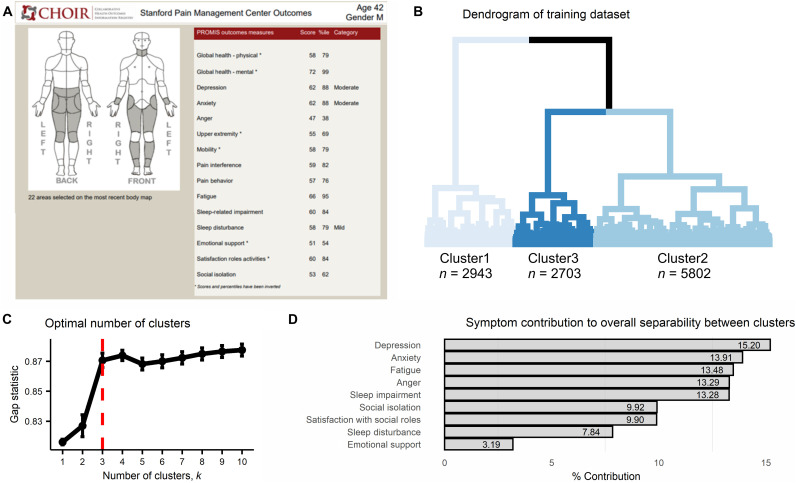
Fig. 1. Cluster development.
(A) An illustration of a simulated CHOIR report used at the Stanford Pain Clinics. The CHOIR body map with marked regions in pain is on the left, and multiple normalized symptom scores are listed on the right. (B) The dendrogram reflecting results of the agglomerative hierarchical clustering algorithm as implemented on the training dataset (n = 11448) and using the nine clustering symptoms. The three-cluster solution is reflected by the different shades of blue per cluster. Cluster1 composed of 25.71% of the patients (n = 2943), Cluster2 of 50.68% (n = 5802), and Cluster3 of 23.61% (n = 2703). (C) The plot shows the gap statistic values for different k number of clusters, and a red dashed line indicates the optimal solution of k = 3 since it is the smallest value of k that is within one standard deviation of the value of k that maximizes the gap statistic. The error bars represent one standard error of the estimated gap statistic. (D) The plot shows the percent contribution to the overall separability between clusters of each of the nine clustering symptoms, in the order of most contributing (depression = 15.20%) to least (emotional support = 3.19%).

