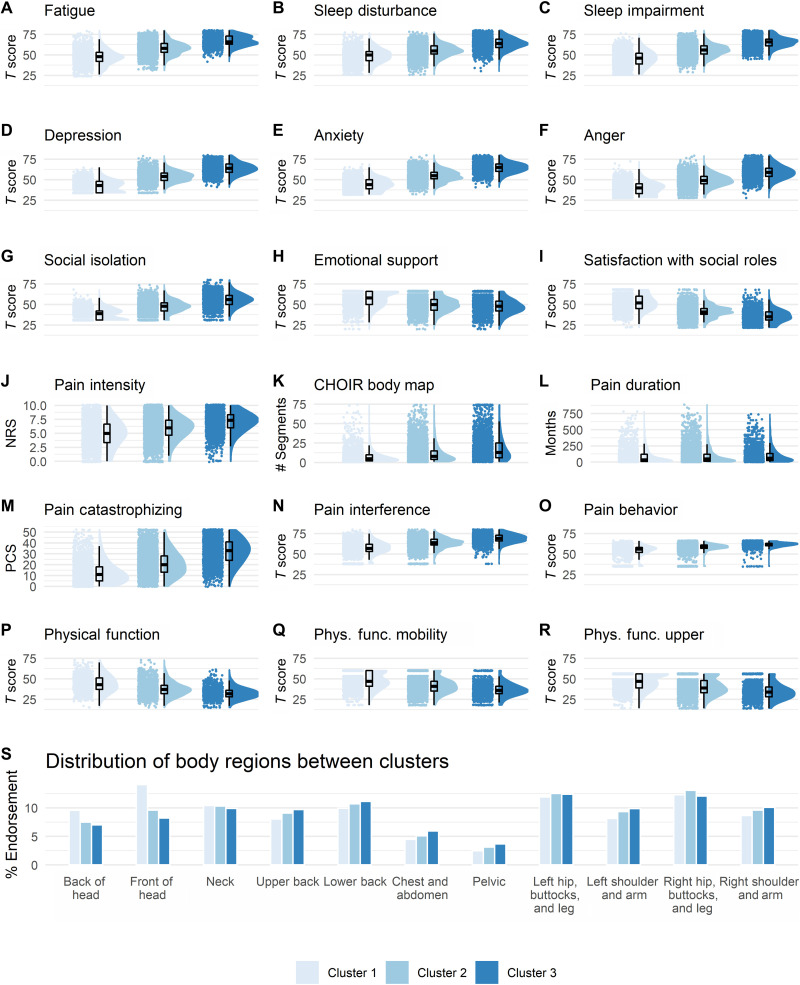
Fig. 2. Cluster characterization and diagnostic-like validation.
A graded scale of severity is manifested across all clustering symptoms (A to I) and all pain-specific measures (J to R), such that Cluster1 reflects a low severity, Cluster2 reflects a medium severity, and Cluster3 reflects the worst severity. Raincloud plots combining jittered raw data, data distribution, and boxplots were generated using open source code (93). Complementary descriptive and inferential statistical information is provided in Table 2. (S) The plot shows the % endorsement of 11 body regions as distributed in each of the clusters. There was no significant association in the distribution of % endorsed body regions between the clusters (P = 0.99). NRS, Numerical Rating Scale; PCS, Pain Catastrophizing Scale.

