FIG. 2.
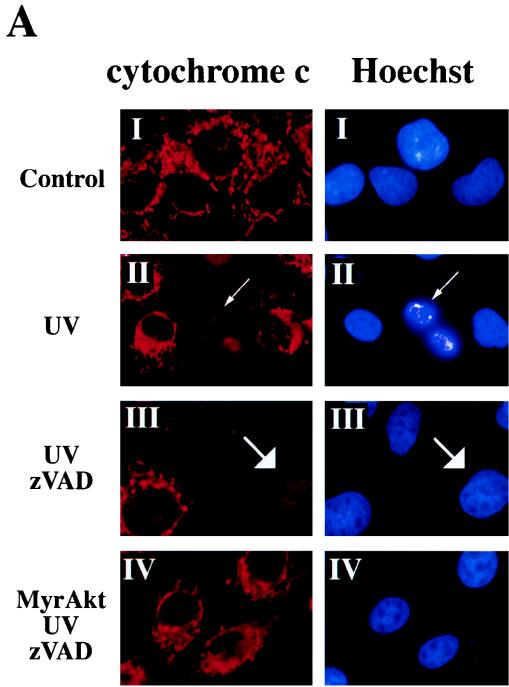
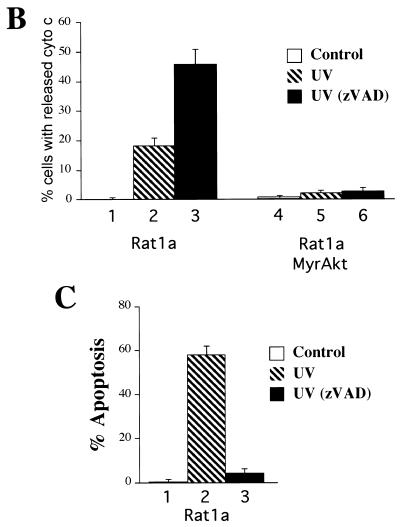
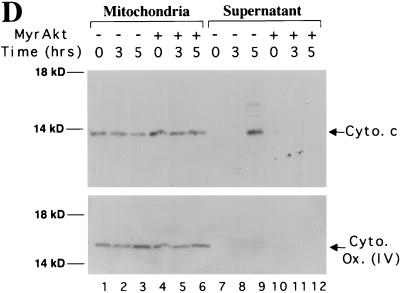
Akt prevents the release of cytochrome c from mitochondria in a caspase-independent manner. (A) Cytochrome c immunostaining and Hoechst staining of Rat1a and Rat1a/MyrAkt cells. Fixation and staining of the cells was done 3.5 h after treatment as described in Materials and Methods. (I) Rat1a cells were deprived of serum for 20 min. (II) Rat1a cells were deprived of serum for 20 min and then irradiated with UV light. Arrows indicates diffused cytochrome c staining and nucleus with condensed chromatin in a cell undergoing apoptosis. (III) Rat1a cells were pretreated with 100 mM zVAD for 20 min, deprived of serum, and UV irradiated. Arrows indicate diffused cytochrome c staining and the corresponding nucleus of a cell protected from apoptosis. (IV) Rat1a/MyrAkt cells were treated as for panel III. (B) Quantitation of cells with diffused cytochrome (cyto) c staining. Averages (± standard error) of at least 100 cells from three independent experiments are shown. (C) Preincubation of Ra1a cells with zVAD is sufficient to prevent apoptosis as measured by DAPI staining. Cells were deprived of serum for 20 min and then either mock treated or treated with 100 μM zVAD for 20 min followed by UV irradiation (50 J/m2), as indicated. After an additional 5 h, cells were DAPI stained and scored for nuclear condensation. Averages (± standard errors) of at least 300 cells from three independent experiments are shown. (D) Rat1a (lanes 1 to 3 and 7 to 9) and Rat1a/MyrAkt (lanes 4 to 6 and 10 to 12) cells were deprived of serum for 20 min and then irradiated with 50 J of UV light as described for panel A. Cells were mechanically lysed and separated into mitochondrial and supernatant fractions 0, 3, and 5 h following irradiation as described in Materials and Methods. Fractions were subjected to SDS-PAGE (15% gel) followed by immunoblot analysis. Cytochrome c (Cyto. c) and COX IV [Cyto. Ox. subunit (IV)] are indicated by arrows. Positions of molecular weight markers are indicated on the left.


