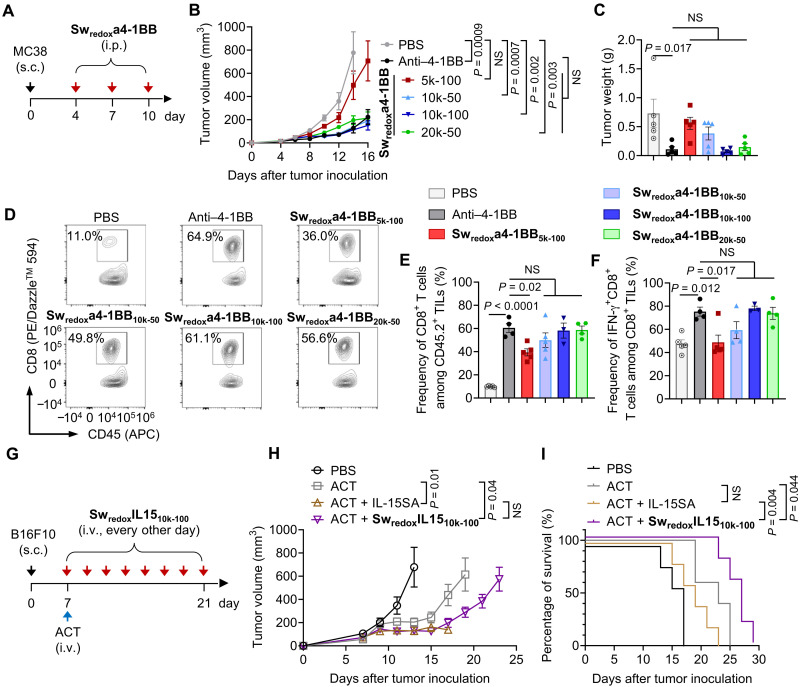
Fig. 3. Selective switch on of Sw-IMs in the TME leading to equivalent antitumor immunity to the native IMs.
(A to F) C57BL/6 mice were inoculated subcutaneously (s.c.) with MC38 murine colon adenocarcinoma tumor cells (2 × 10⁵) and received intraperitoneal (i.p.) administration of native anti–4-1BB (100 μg), Swredoxa4-1BBs (equivalent dose of anti–4-1BB), or phosphate-buffered saline (PBS) on days 4, 7, and 10. Mice were euthanized on day 16, and the tumors were processed and analyzed by flow cytometry (n = 5 mice). (B) Average tumor growth curves. (C) Average tumor weight on day 16. (D) Representative flow cytometry plots showing the frequencies of CD8+ T cells among CD45.2+ tumor-infiltrating lymphocytes (TILs). (E) Average frequencies of CD8+ T cell among CD45.2+ TILs. (F) Average frequencies of interferon-γ (IFN-γ)–secreting CD8+ T cells among CD8+ TILs. (G to I) C57BL/6 mice were inoculated subcutaneously with B16F10 murine melanoma cells (5 × 10⁵) and received ACT of activated Pmel Thy1.1+CD8+ T cells (1 × 10⁷) on day 7 followed by intravenous (i.v.) administration of native IL-15SA (5 μg), SwredoxIL1510k-100 (equivalent dose of IL-15SA), or PBS every other day from day 7 to day 21 (n = 5 mice). (H) Average tumor growth curves. (I) Survival curves. All data represent the mean ± SEM and are analyzed by one-way analysis of variance (ANOVA) or log-rank test; NS, not significant (P > 0.05).

