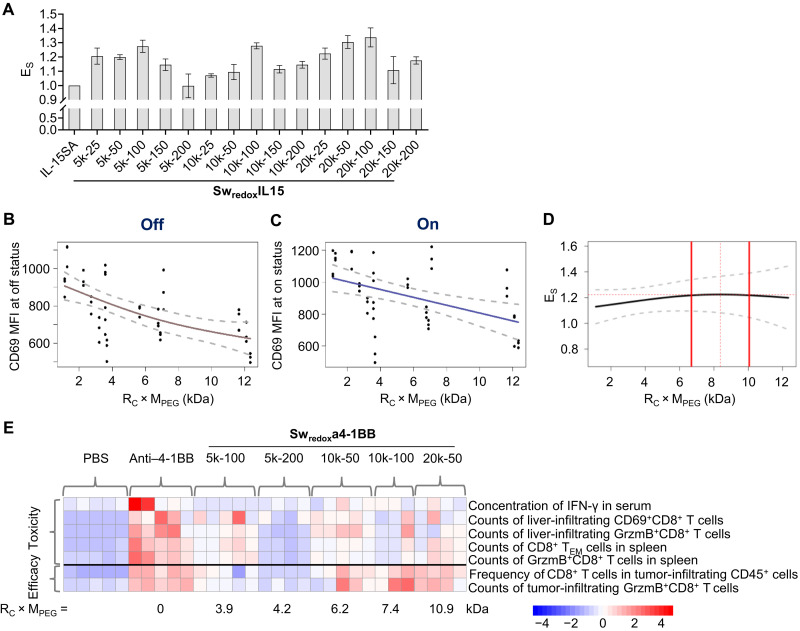
Fig. 6. Investigation of the optimum formulation parameters of Sw-IMs.
(A) Comprehensive performance index (ES) of SwredoxIL15s of different formulations. ES = CD69 MFI at on status/CD69 MFI at off status. (B and C) Plots of CD69 MFI of CD8+ T cells cultured with SwredoxIL15s at off and on status as a function of the comprehensive formulation index RC × MPEG. (D) Plot of ES as a function of RC × MPEG. Gray dashed lines indicate 95% prediction intervals (B to D). Red dashed line indicates the peak value. Thick red lines indicate optimal range defined as 30% of the range of data on the x axis, centered on the peak value. (E) Heatmap illustrating the average of the indicated parameters for in vivo toxicity (above the black line) and therapeutic efficacy (below the black line). Rows represent averaged z scores. Each column represents a treated mouse receiving the indicated treatment.

