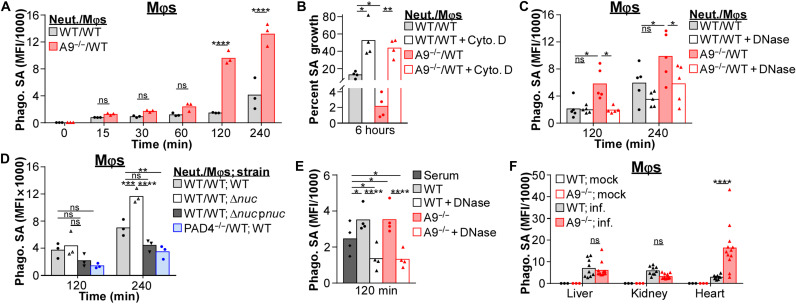
Fig. 7. NET formation enhances phagocytosis of S. aureus by Mφs.
(A to E) Immune cells were cultured with fluorescently labeled S. aureus (MOI = 10). (A) Phagocytosis of S. aureus by Mφs in coculture (ratio = 1:1) with neutrophils (Neut.) was quantified by flow cytometry. Background MFI was subtracted from each time point. Each point represents immune cells isolated from a single mouse (n = 3). (B) Mφs were pretreated with cytochalasin D (Cyto. D; 10 μg/ml) for 1 hour before adding neutrophils and S. aureus. Percent growth of S. aureus was calculated relative to S. aureus growth in the absence of immune cells. Each point represents the mean result (biological triplicate) of immune cells isolated from a single mouse (n = 4). (C and D) Phagocytosis of S. aureus by Mφs in coculture with neutrophils was quantified by flow cytometry. Background MFI was subtracted from each time point. (C) Immune cells cultured with S. aureus in the presence of DNase (8 U/ml). Each point represents immune cells isolated from a single mouse (C, n = 5; D, n = 3). (E) Phagocytosis of S. aureus by Mφs was quantified by flow cytometry. Background MFI was subtracted from each time point. NETs used for S. aureus opsonization were isolated from neutrophils stimulated with PMA (100 nM) for 4 hours and cultured with Mφs in the presence of DNase (8 U/ml). Each point represents immune cells isolated from a single mouse (n = 4). (F) Mice were systemically infected with a fluorescent strain of S. aureus (pSarA_sfGFP; CFU = 2 × 10⁷). At 4 dpi, organs were homogenized and S. aureus levels within Mφs (CD11b+F4/80+Ly6G−) in the heart were quantified by flow cytometry. Background MFI from uninfected mice was subtracted from infected. Each point represents a single mouse (mock, n = 3) (WT; inf., n = 9) (A9−/−; inf., n = 12). Two-way ANOVA with (A) Sidak’s or (B to F) Tukey multiple comparisons test (*P ≤ 0.05, **P ≤ 0.01, ***P ≤ 0.001, and ****P ≤ 0.0001).

