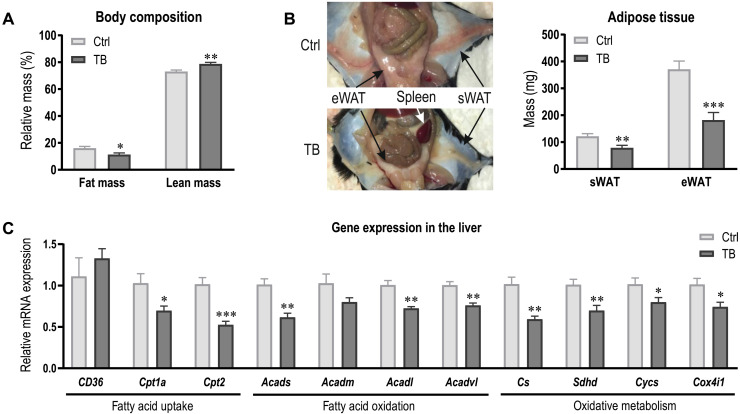
Fig. 5. Increased lipolysis and reduced fatty acid oxidation in the liver contributes to altered lipid profile in TB mice.
(A) Body composition of Ctrl and TB mice assessed by EchoMRI at the end of the study. (B) Representative image depicting the fat loss and splenomegaly in TB mice. Quantification of eWAT and sWAT mass. (C) Relative mRNA expression levels of genes involved in fatty acid uptake and oxidation and oxidative capacity were measured in the liver of Ctrl and TB mice. Groups (n = 6 to 7 per group) were compared by two-tailed unpaired t tests with Welch’s correction and data are represented as means + SEM. Asterisks indicate differences between Ctrl and TB group. *P < 0.05, **P < 0.01, and ***P < 0.001. Cpt, Carnitine palmitoyltransferase; Acad, acyl-CoA dehydrogenases; Cs, citrate synthase; Sdh, succinate dehydrogenase; Cycs, cytochrome c; Cox, cytochrome c oxidase. Photo credit: Regula Furrer, University of Basel.

