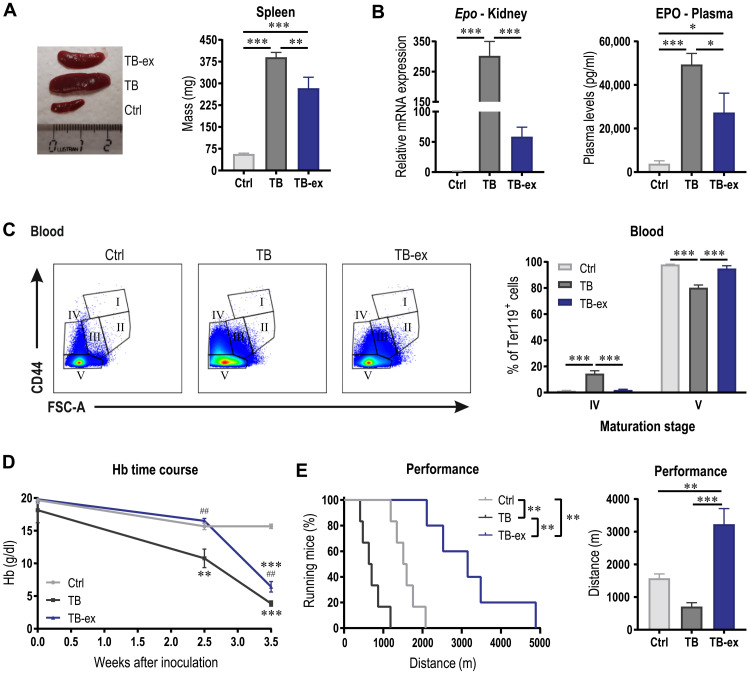
Fig. 8. Exercise delays the onset of anemia and substantially elevates performance.
(A) Representative image and quantified spleen mass of Ctrl, TB, and TB-ex mice 3.5 weeks after tumor cell inoculation. The ruler is in centimeters. (B) EPO levels in kidney and plasma. (C) Maturation of Ter119+ cells in blood were analyzed according to their size and CD44 expression as shown in the representative flow cytometry plots and quantified in the bar graph. (D) Time course of Hb levels in Ctrl, TB, and TB-ex mice throughout the study. (E) The effects of the intervention on maximal performance tested on a motorized treadmill represented as a Kaplan-Meier Curve or bar graph showing maximal distance covered by the mice. Kaplan-Meier curves were compared with a log-rank test, differences between groups (n = 5 to 7 per group) were tested with one-way ANOVAs followed by Tukey’s post hoc analysis, and data are represented as means + SEM. *P < 0.05, **P < 0.01, and ***P < 0.001. In (D), asterisks indicate differences compared to Ctrl mice and # compared to TB mice. Photo credit: Regula Furrer, University of Basel.

