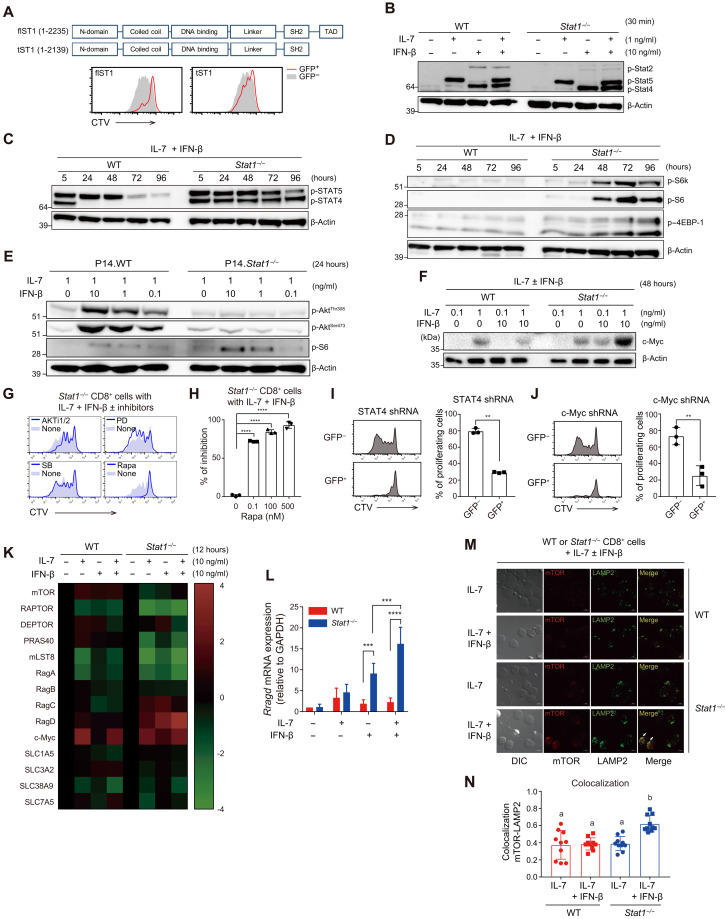
Fig. 4. Stat1−/− naïve CD8+ T cells respond to T1IFN and IL-7 via activating STAT4-RagD-mTOR and cMYC signaling pathways.
(A) In vitro proliferation of Stat1−/− CD8+ T cells transduced with retroviral vectors encoding either full-length (fl) or truncated (t) construct of Stat1 gene in response to IL-7 and IFN-β. (B) Phosphorylation of STAT2, STAT4, and STAT5 in WT and Stat1−/− naïve CD8+ T cells at 30 min after culture with IL-7 and IFN-β. (C) Phosphorylation of STAT4 and STAT5 and of (D) S6K, S6, and 4EBP-1 in WT and Stat1−/− naïve CD8+ T cells at various time points after culture with IL-7 and IFN-β. (E) Phosphorylation of AKT in WT and Stat1−/− naïve CD8+ T cells at 24 hours after culture with various concentrations of IL-7 and IFN-β. (F) Expression of c-Myc in WT and Stat1−/− naïve CD8+ T cells at 48 hours after culture with IL-7 and/or IFN-β. (G and H) In vitro proliferation of Stat1−/− CD8+ T cells by IL-7 and IFN-β in the presence or absence of various indicated inhibitors. (I and J) In vitro proliferation of Stat1−/− CD8+ T cells transduced with retroviral vectors encoding (I) STAT4 shRNA or (J) c-Myc shRNA in response to IL-7 and IFN-β. (K) Heatmap for the relative expression of gene transcripts related to mTOR signaling pathways in WT and Stat1−/− naïve CD8+ T cells at 12 hours after culture with IL-7 and IFN-β. (L) Expression levels of mRNA encoding RagD as shown in (K). GAPDH, glyceraldehyde-3-phosphate dehydrogenase. (M and N) Colocalization of mTOR and LAMP2 in WT and Stat1−/− naïve CD8+ T cells at 72 hours after culture with IL-7 and IFN-β. The results are presented as means ± SEM. Data are representative of three to four independent experiments. **P < 0.01, ***P < 0.001, ****P < 0.0001 by unpaired Student’s t test. The letters “a” and “b” (P < 0.05) in (N) are calculated by one-way analysis of variance (ANOVA) followed by Tukey’s multiple comparison test.

