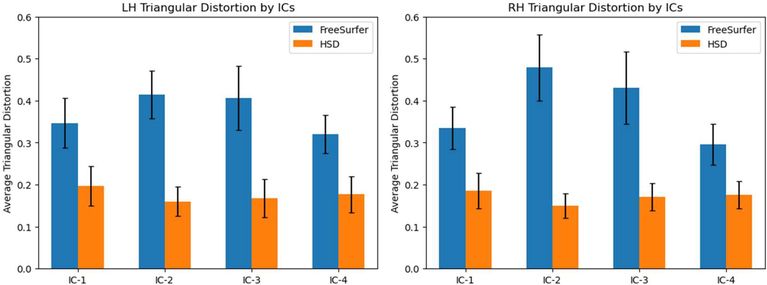
Figure 6:
Average distortion in activated regions in each individual component. The black error bars are standard deviations across 100 subjects. Paired sample t-tests were conducted for each component from both hemispheres with multi-comparison correction by FDR (q=0.05). HSD achieves a lower level of registration distortion across all individual components in both hemispheres than FreeSurfer (p<10−10). This suggests the locally different patterns as shown in Figure 5.

