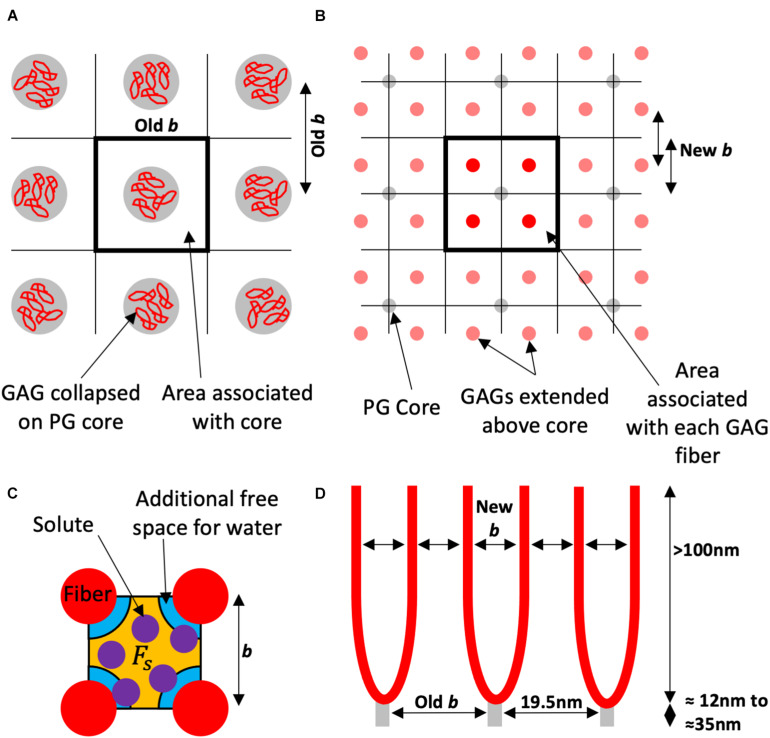
FIGURE 1.
Schematic of the proposed model using the square lattice example. (A) Looking to the wall from the lumen the electron microscopy visualizes the proteoglycan (PG) core protein with the glycosaminoglycan (GAG) fibers collapsed around them. This gives an inter-fiber spacing (Old b) that has been measured experimentally as 19.5 nm, and an area associated with each fiber for the solvent and solute to pass. (B) The red GAG fibers (in this example four per core protein), are unraveled and spaced accordingly (in this case also into square ordering). Each fiber in this example has of the associated area to the PG core protein, and a new spacing (New b). (C) The orange free space (Fs) for the purple solute is a proportion of the free space for water which has the orange and the additional blue space. The water is only excluded by the fiber diameter. This proportion is used to estimate the solute reflection coefficient. (D) Is a side view of the endothelial glycocalyx (eGlx) with the PG core protein spaced as “Old b” or 19.5 nm. There is now a new spacing “New b” between GAG fibers and a different fiber diameter to calculate the proportions of free space.

