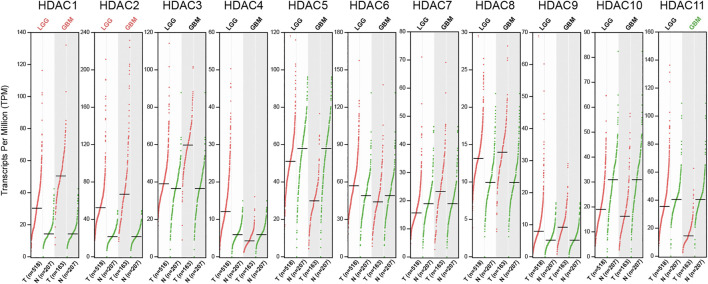
FIGURE 2.
RNA-seq data of HDAC family in LGG and GBM accessed from GEPIA. The Scatter plots showed expression comparisons of the HDAC family between the tumor and the normal groups. The statistically significant comparison with |Log2FC| over 1 was marked either in red (upregulation) or green (downregulation) (q < 0.01).

