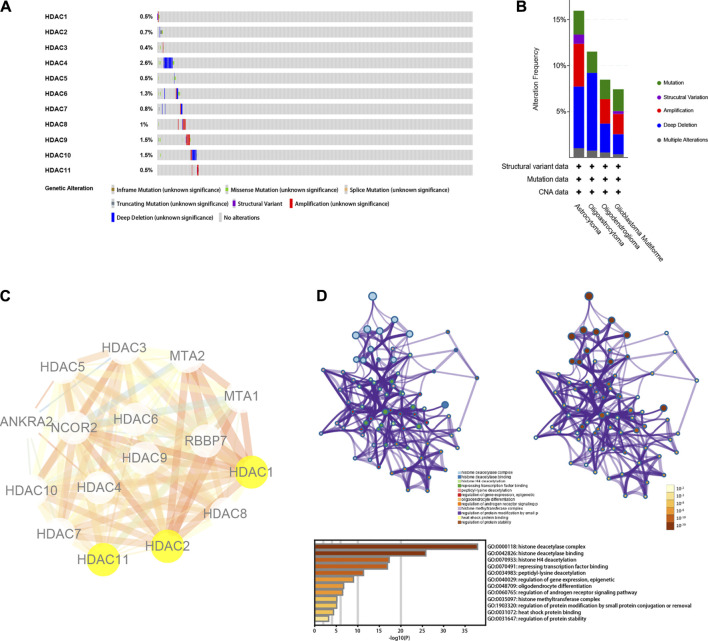
FIGURE 8.
Genetic mutation, interactive network, and functional enrichment of HDAC family. (A,B) Summary for genetic alterations of HDAC family in glioma. (C) Protein-protein interactive network of HDAC family by STRING. The size of the edges in the network was set to change according to the co-expression value among the nodes. The color of the edges in the network altered with the combined scores from the low to the high, which were all the evidence scores (including transferred scores). (D) Functional enrichment plot and annotation by Metascape.

