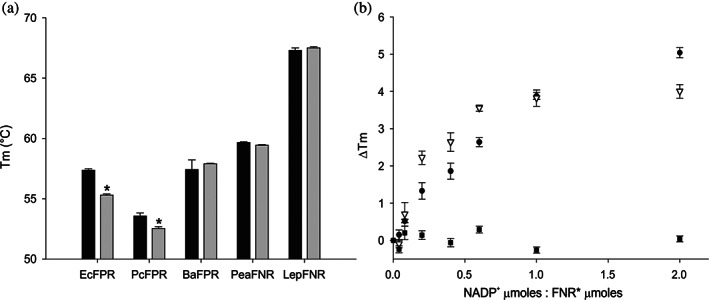
FIGURE 1.

Stability analysis of the FNR. T m determination by adjusting the real‐time denaturation curves. (a) Comparison of the stability of the different FNRs un‐eluted (FNR, black bars) and eluted (FNR*, grey bars) from the Cibacron Blue column. (b) Comparison of the thermal stabilities of EcFPR (circles), PcFPR (triangles), and PeaFNR (squares) with increasing concentrations of NADP+. Bars indicate mean ± SD of three independent experiments
