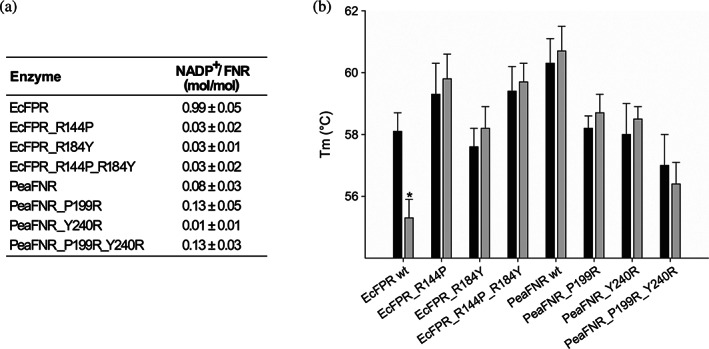
FIGURE 3.

Relationship between NADP+ content and thermal stability of wild type and mutant EcFPR and PeaFNR. (a) Estimation of the NADP+ content bound to each reductase based on the NADPH generated by the reaction of G6PD. Values are mean ± SD of at least three independent measurements. (b) Comparison of the thermal stability of wild type and mutant EcFPR and PeaFNR un‐eluted (black bars) and eluted (grey bars) from the Cibacron Blue column. Bars indicate mean ± SD of three independent experiments
