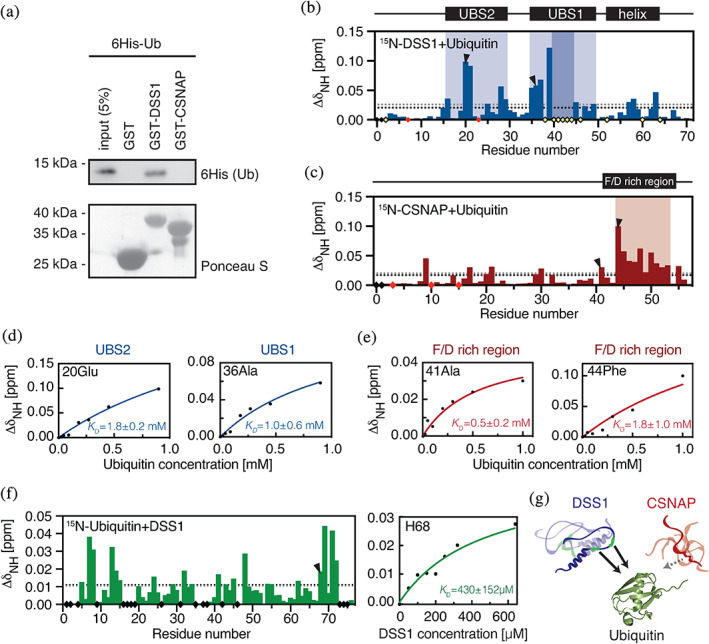
FIGURE 3.

Ubiquitin binding to DSS1 and CSNAP. (a) Ubiquitin co‐precipitation assays. Purified GST‐DSS1, GST‐CSNAP or, as a control, GST alone, was incubated with 6His‐tagged human ubiquitin. After precipitation with glutathione Sepharose beads, the material was analyzed by SDS‐PAGE and western blotting using antibodies to the 6His‐tag on ubiquitin (Ub). Ponceau S staining was used to assess loading. CSP of (b) DSS1 and (c) CSNAP in the presence of 10 times molar excess of ubiquitin with UBS1 and UBS2 in DSS1 indicated in light shaded blue (disappearing residues in darker color) and the weak ubiquitin interaction region in CSNAP in light shaded red. Disappearing signals are displayed as yellow diamonds, unassigned residues as black diamonds and prolines as red diamonds. The black and grey dotted lines correspond to the mean CSP and the standard deviation, respectively. (d) Changes in chemical shift by increasing ubiquitin concentrations for DSS1‐Glu20 (top right) located in the proposed UBS2 and DSS1‐Ala36 (bottom right) in UBS1. The blue lines are global fits of residues within the individual regions. (e) Changes in chemical shifts of CSNAP‐Ala41 and CSNAP‐Phe44 upon increasing ubiquitin concentrations, each demonstrating different binding behavior. The red line corresponds to a global fit of the residues with similar binding saturation (Group1: 41Ala, 45 Asn and 47Phe; Group 2: 44Phe, 46Asp, 48Glu, 50 Leu). (f) CSP of 15N‐ubiquitin in the presence of 8 times molar excess of DSS1 at 25°C. Right panel: CSP of ubiquitin‐His68 at 10°C with different DSS1 concentrations, green line shows the fitted binding curve. (g) Summarizing illustration showing DSS1 interacting with ubiquitin (PDB:1D3Z) through two regions, whereas CSNAP only has very weak affinity for ubiquitin, not detectable in co‐precipitation assay and likely not physiologically relevant
