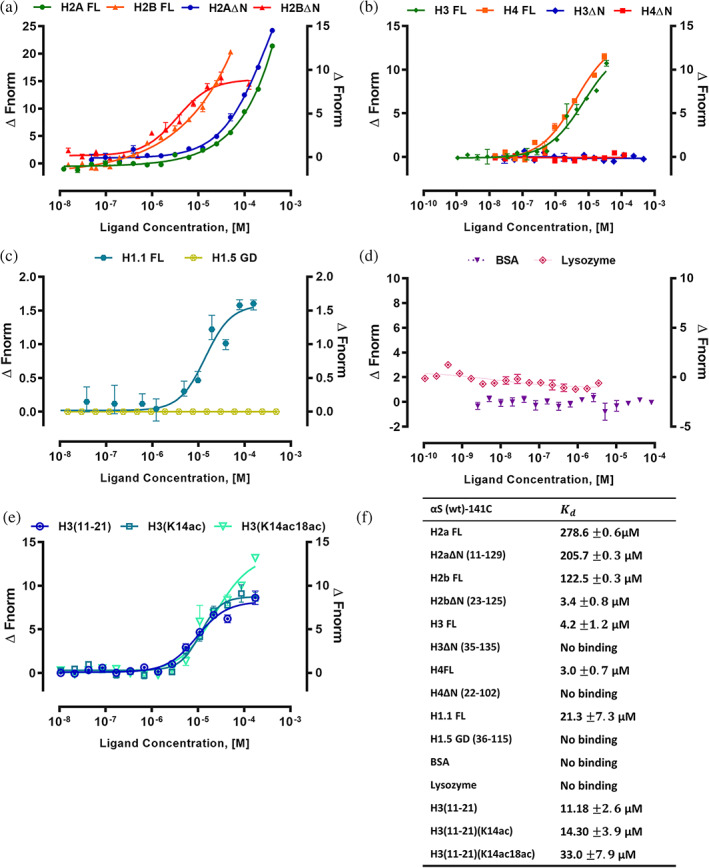
FIGURE 1.

MST analysis of αS(wt)‐141C interactions with histones. Binding curves for the interactions of fluorescently labeled αS(wt)‐141C with (a) H2a FL, H2aΔN (12–129), H2b FL and H2bΔN (24–125). (b) H3 FL, H3ΔN (36–135), H4FL, and H4ΔN (23–102). (c) H1.1 FL and H1.5‐GD (37–116), (d) BSA and lysozyme as controls, and (e) The histone H3(11–21) peptide (unmodified), H3(11–21) with K14ac, and H3(11–21) with K14acK18ac were shown as the change in normalized fluorescence (ΔFnorm). (f) The values are summarized in the table. Error bars represent SEM (n = 3)
