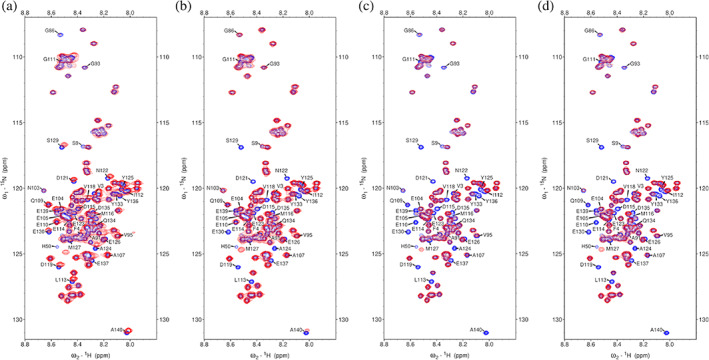
FIGURE 2.

1H‐15N HSQC spectra of αS(wt) in the absence (blue) and presence of (red); (a) H2A (1:0.9), (b) H2B (1:0.9), (c) H3 (1:0.9), and (d) H4 (1:0.5). The labeled residues are those in αS(wt) that undergo significant chemical shift perturbations on addition of various histones
