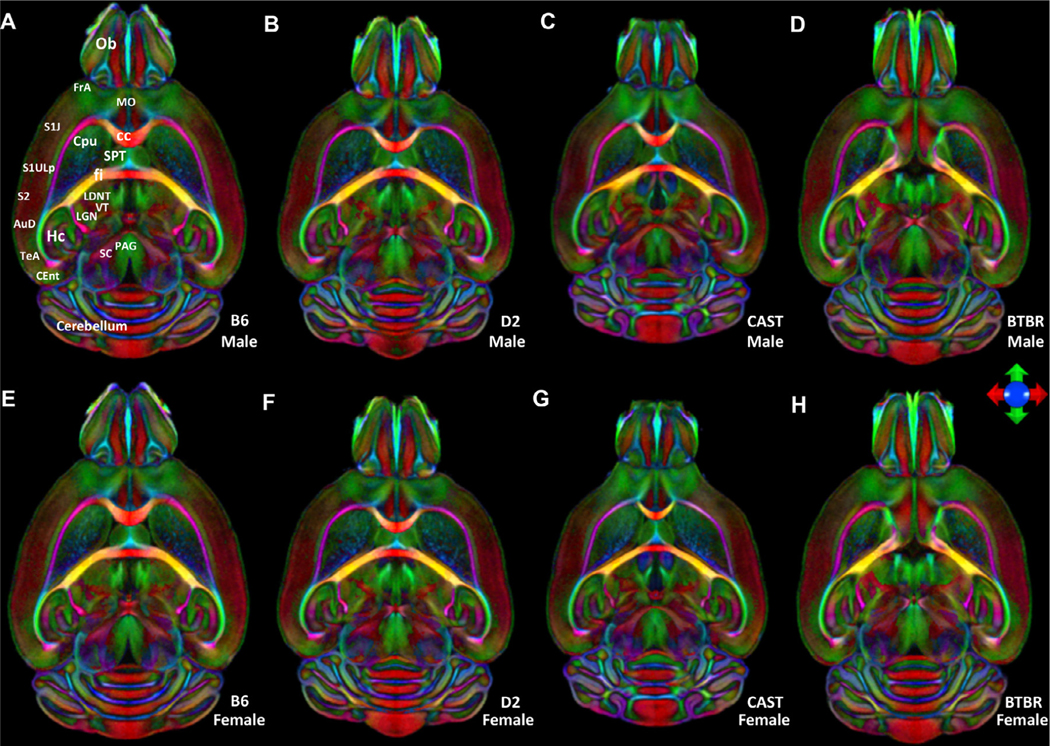
Fig. 1.
Horizontal color FA images from the average male (top) and average female bottom). Images are color-coded averages of four cases per sex that highlight orientation of fiber tracts (the principal eigenvector). The icon shows the key for encoding the eigenvectors: green- anterior/posterior; blue- dorsal/ventral; red- left/right. (A) and (E) B6, (B) and (F) D2, (C) and (G) CAST, (D) and (H) BTBR. Ob: olfactory bulb; FrA: Frontal association Cortex; MO: Medial Orbital Cortex; S1J,S1ULP;: Primary Somatosensory Cortex;S2: secondary somatosensory cortex; AuD: secondary auditory cortex; TeA: Temporal association cortex; CEnt: caudomedial entorhinal cortex; HC: hippocampus; SC: superior colliculus; PAG: Periaquaductal grey; LGN: lateral geniculate nucleus; VT: ventral thalamic nuclei; LDNT: latero dorsal nucleus of thalamus; fi: Fimbria; cc: corpus callosum; SPT: Septum; Cpu: striatum

