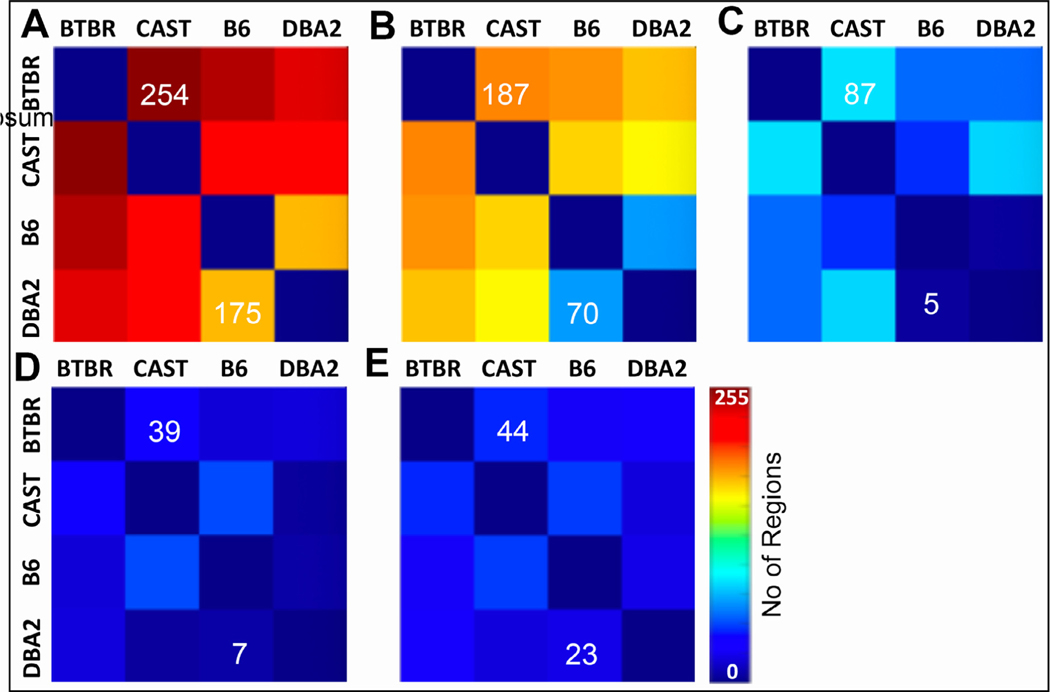
Fig. 3.
ANOVA comparisons were performed to determine the number of regions of interest (from the total of 322 I.e. 2 × 166) that were statistically different between any two strains. Heatmaps help visualize which strain differences are the greatest. The heat scale goes from 0 to 255 where the color indicates the number of regions (out of 322) in which the metric (volume, FA, RD, MD, AD) is significantly different (Benjamini-Hochberg corrected p < 0.05). For example, volumes are significantly different in 254 regions when comparing BTBR and CAST; there are 176 regions that are different between DBA2 and B6. The color scale hopefully allows one to appreciate that volume is different between many regions while there are relatively few regions of interest (44–23) that are different in AD.

