Fig. 6.
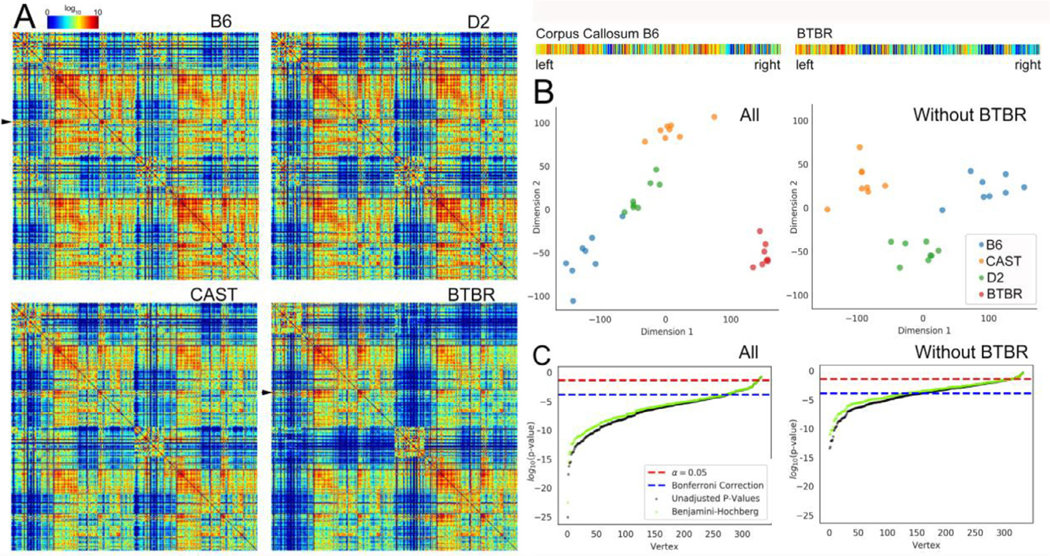
(A) Whole brain connectome for each strain. The connectomes (n = 8) of (a) B6; (b) D2, and (c) CAST strains were similar. The average connectome of the BTBR was significantly different with the reduced connectivity evident from the increased number of holes (dark blue entries). The seed nodes (Faraji et al., 2018) and targets (columns) are ordered according to the developmental origins. The arrows identify the corpus callosum (seed) which was extracted and magnified for comparison between B6 and BTBR. (B) Omnibus embedding improves the confidence in comparisons. The scatter plot shows clustering when the BTBR was included. When the BTBR was excluded, the clustering also shows statistical difference in the three similar strains. (C) Plot of log (p-value) from MANOVA comparisons in vertices across strain vs rank-ordered vertex shows roughly 280 vertices that were statistically different when all four strains were compared and 150 vertices that were different when the BTBR was excluded.

