
Figure 2. Kaplan–Meier curves of MACE free survival in patients with normal and abnormal T1 values (left panel) and T2 values (right panel).
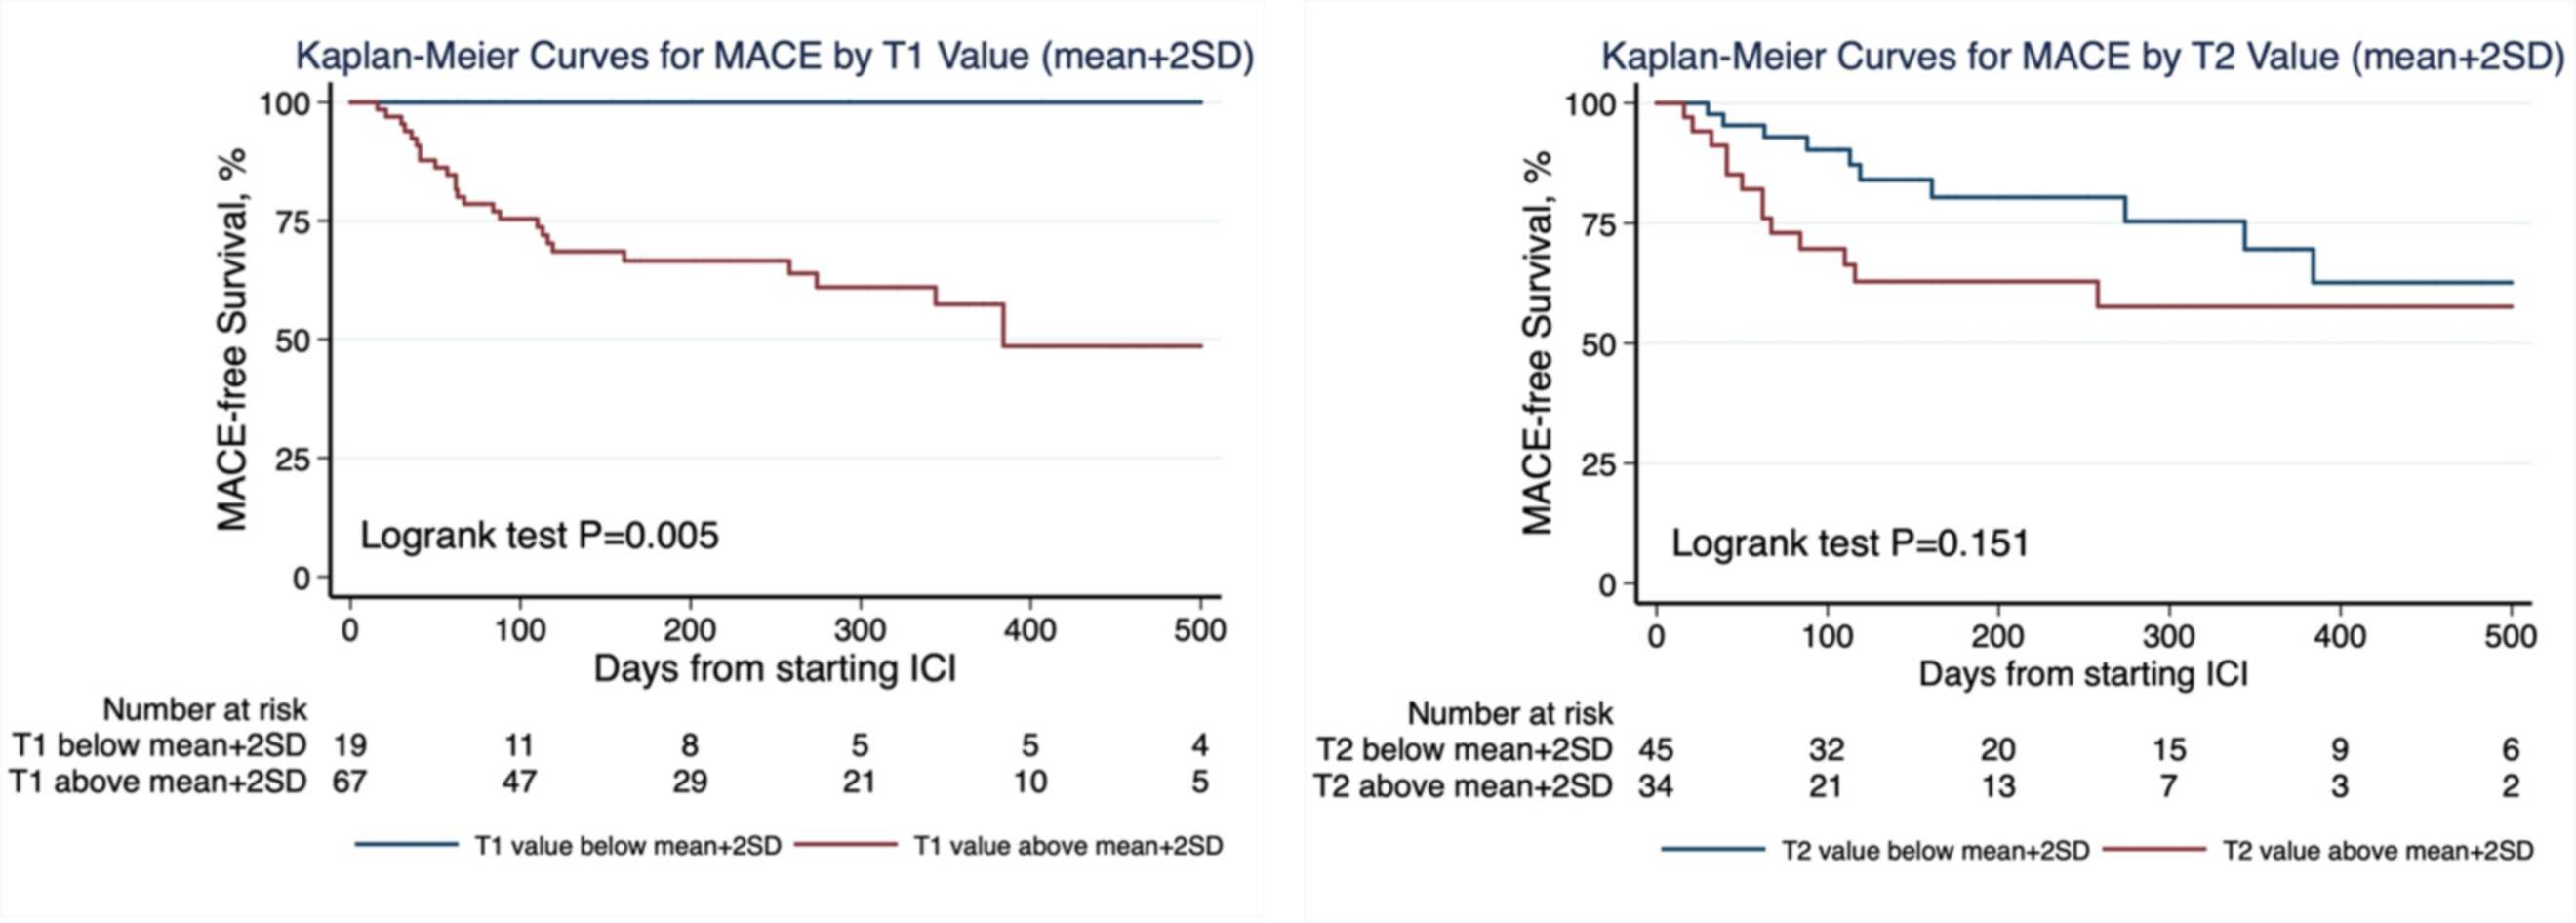
Abnormal values were defined as above mean+2SD of the site, CMR vendor/field strength specific reference ranges.