FIGURE 7.
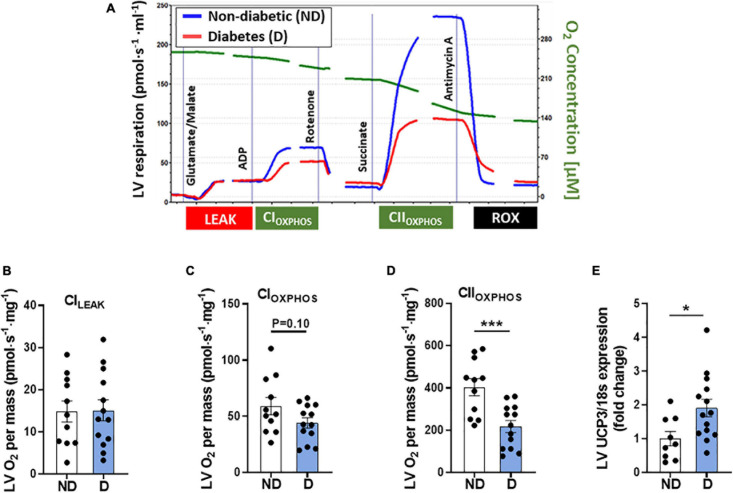
LV mitochondria function in diabetic mice. (A) Representative mitochondrial oxygen consumption trace in diabetic mice (red line) and non-diabetic mice (blue line). Image has been cropped where lines are broken. Cytochrome C addition not shown. Oroboros high-resolution respirometry analysis of: (B) Complex-ILEAK respiration, (C) Complex-I oxygen consumption, (D) Complex-II oxygen consumption. LV gene expression of (E) mitochondrial uncoupling protein-3 (UCP3). Data represented as mean ± SEM. n = 9–14 per group (note individual data points). Data analysis was carried out using unpaired t-test. *P < 0.05, ***P < 0.001. ND, non-diabetic; D, diabetes; LV, left ventricle.

