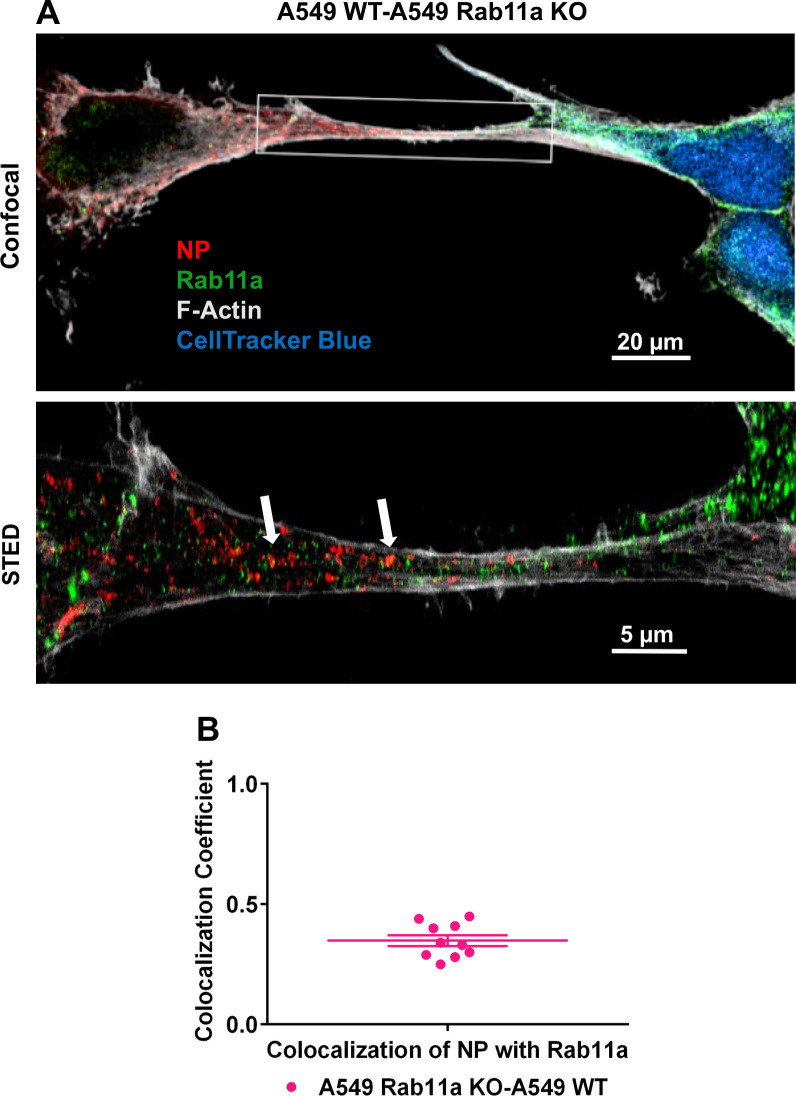
Fig 6. TNTs allow for bidirectional shuttling of Rab11a between cells.
[A]A549 Rab11a KO cells were infected with NL09 viruses and mixed with A549 WT cells pre-stained with CellTracker Blue CMAC dye [blue]. Cells were stained for NP [red], Rab11a [green] and F-Actin [grey]. Representative confocal image is shown with the high-resolution STED images depicted in the inset. [B] Co-localization coefficient of NP and Rab11a within TNTs formed between A549 WT and Rab11a KO cells [n = 10 TNTs]. Error bars represent the SEM of two biological replicates with two technical replicates each.

